
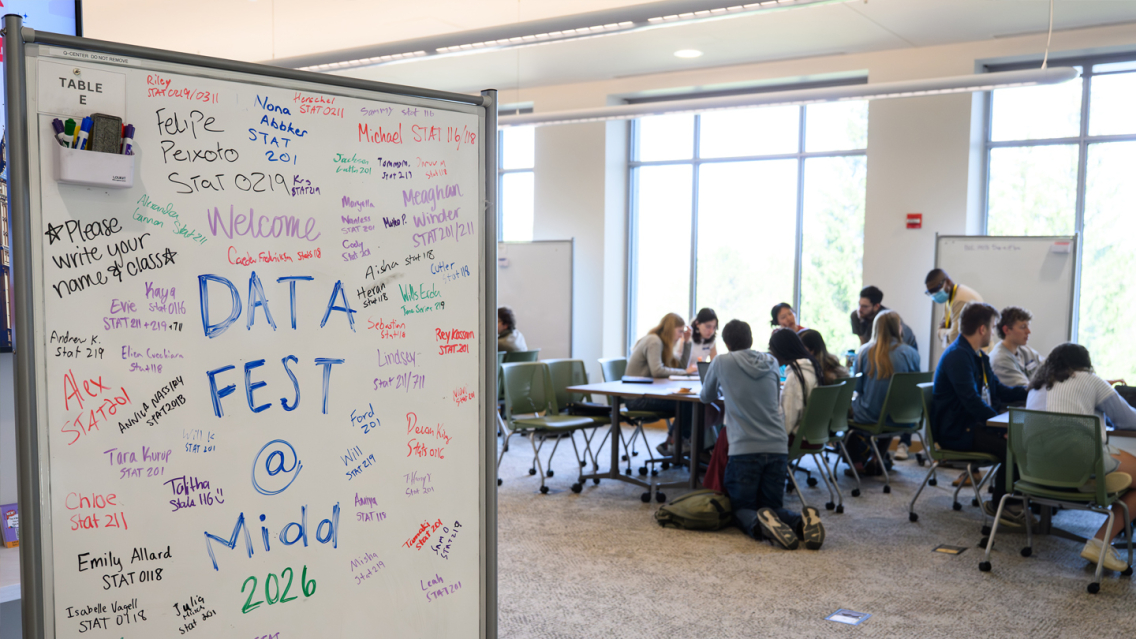
24-Hour DataFest Stretched Students’ Analytical and Creative Thinking Skills

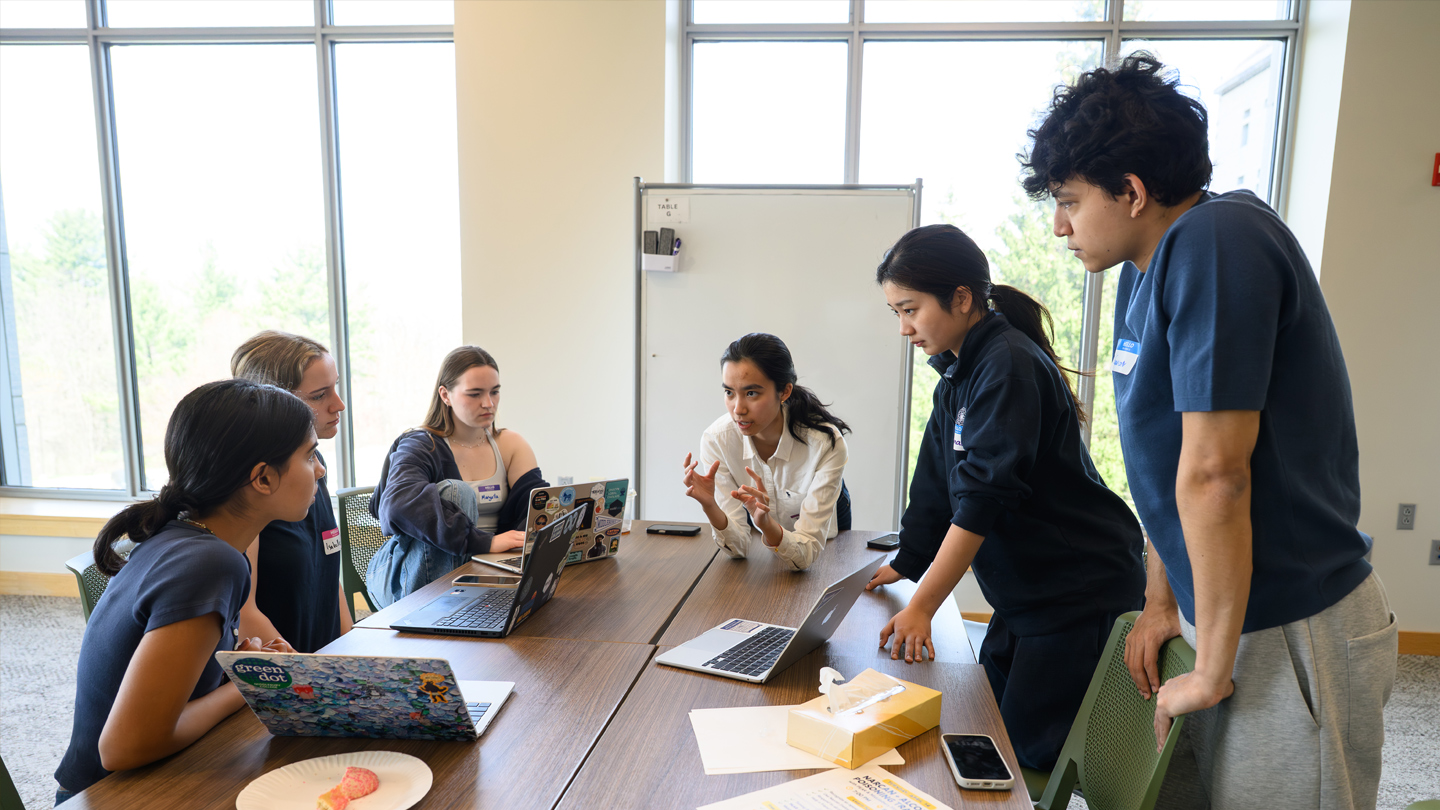
Nearly 150 students seized the challenge of turning big data into something meaningful. Working in teams, the Middlebury undergraduates joined the annual DataFest April 18-19, sponsored by the American Statistical Association. ASA describes the event as “a celebration of data in which teams of students work around the clock to find and share meaning in a large, rich, and complex data set.”
While the specifics of the data are still confidential—other colleges and universities have not yet completed their competitions—the healthcare-related challenge encouraged students to draw insightful conclusions about people’s lives and the institutional infrastructures that can affect the well-being of communities.


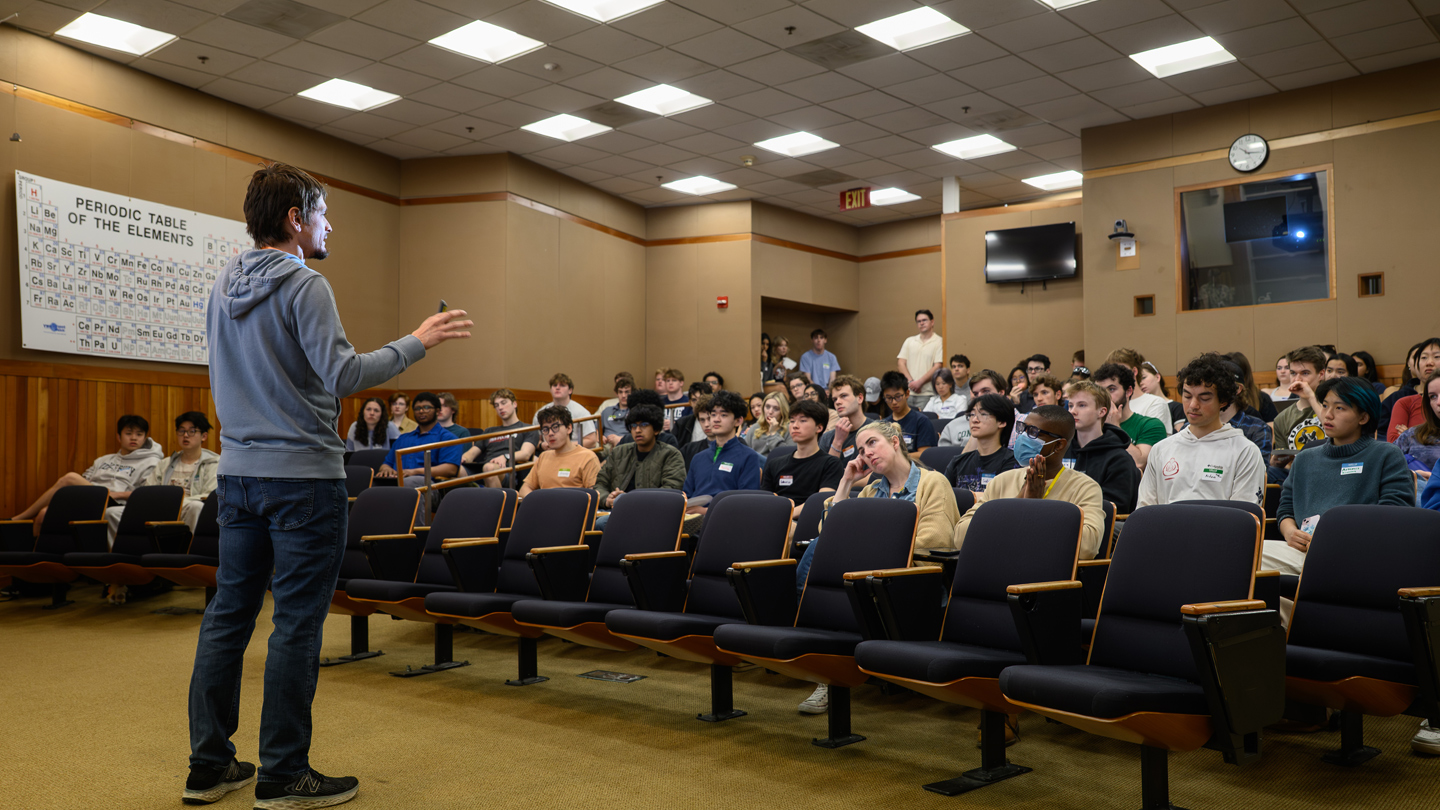


It was an eclectic mix of students. “Essentially all majors across campus were represented,” said Associate Professor of Statistics Alex Lyford, who is also director of Midd.Data. “Students from any major could participate, though most of the students were either currently or previously enrolled in a statistics or data science course, which constitutes about 50 percent of all students at Middlebury.”
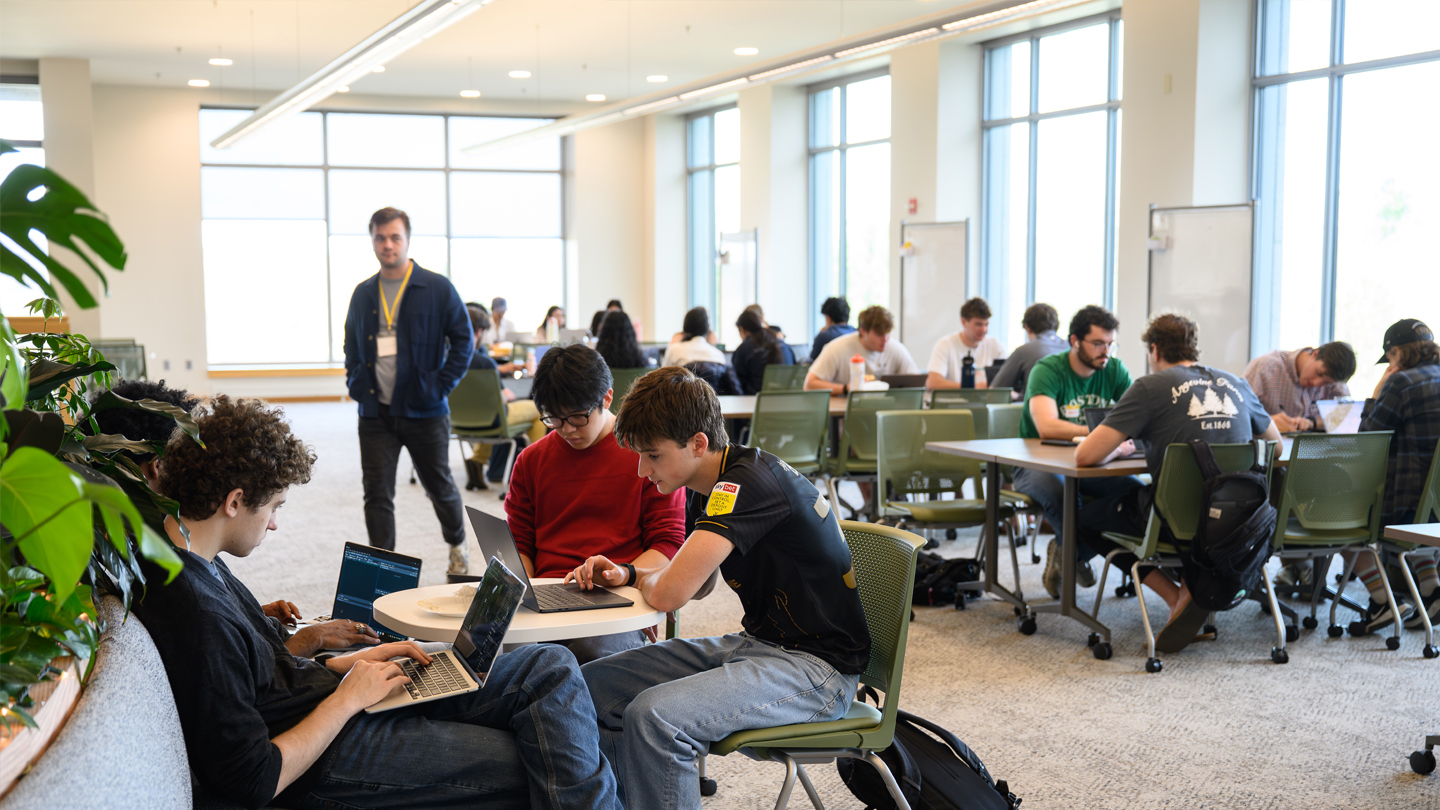
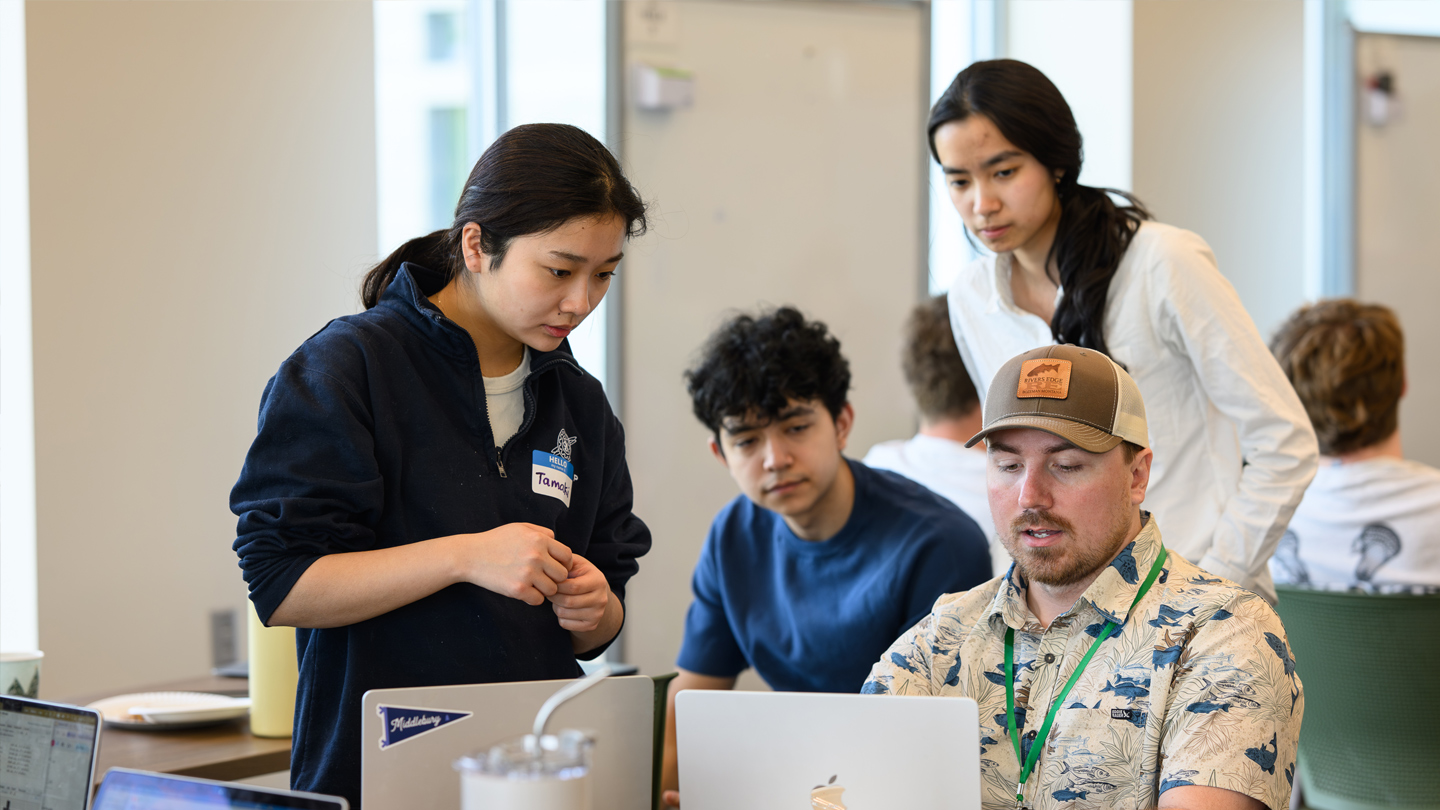
The fun began at the Q-Center in McCardell Bicentennial Hall, where students arrived on Saturday to receive their challenge. Using the center as their headquarters, the teams settled in for the next 24 hours, digging into multiple massive data sets and looking for the best ways to interpret them.
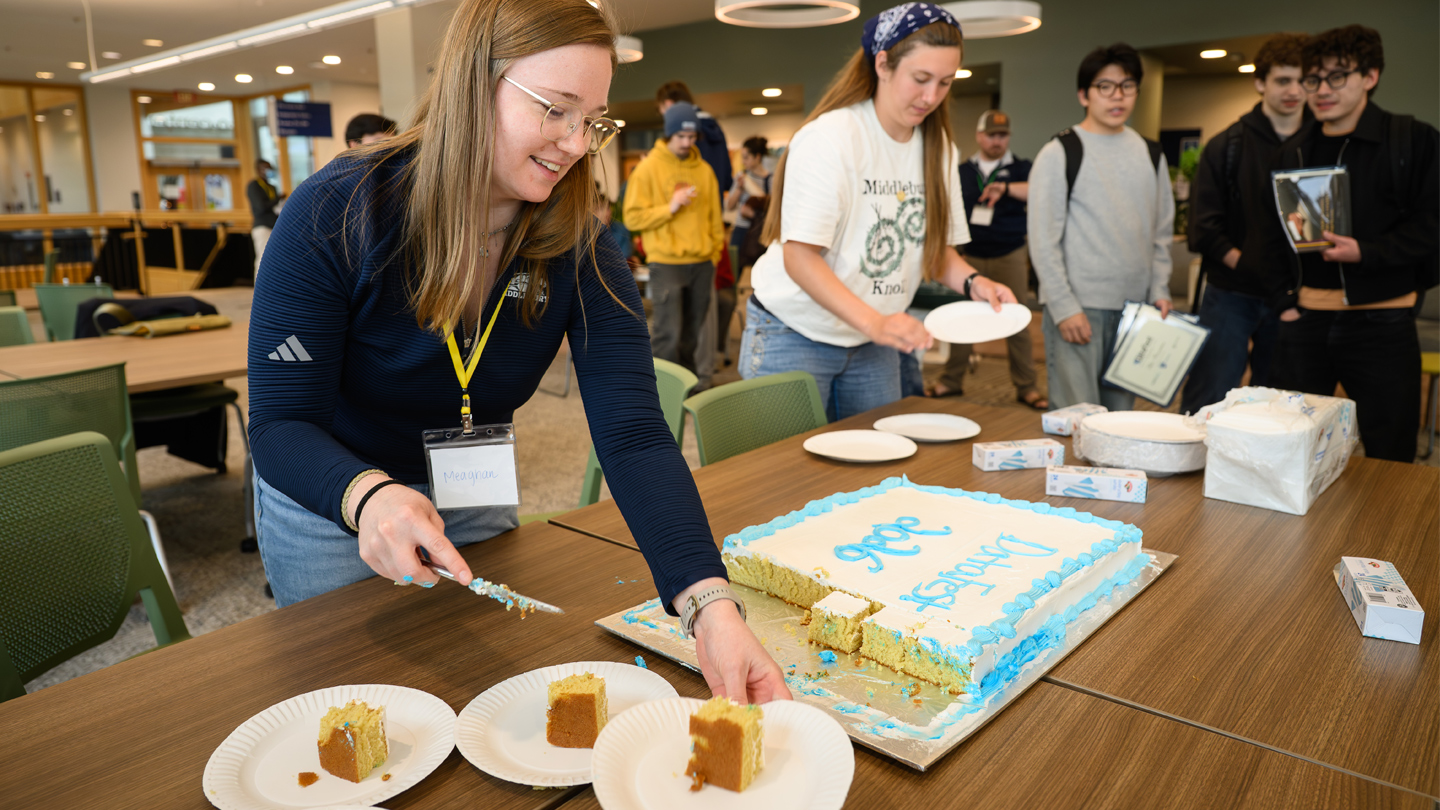
It created a strong sense of community among students who are passionate about data, noted Gyula Zsombok, assistant professor of French and Francophone studies and associate director of Midd.Data. “They networked with one another and bonded over sushi, cookies, games, and, of course, coding. It was a genuinely collaborative and enjoyable experience.”
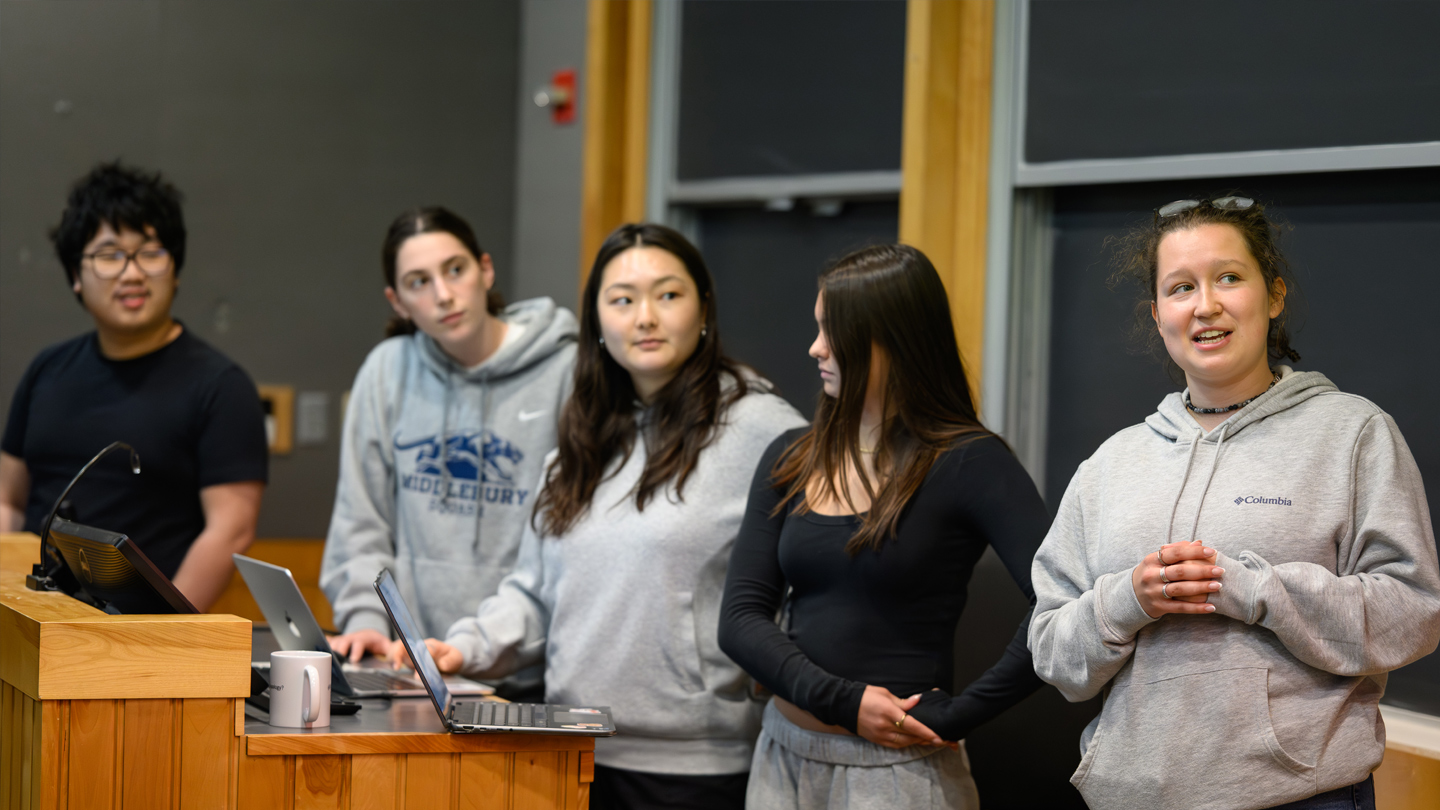
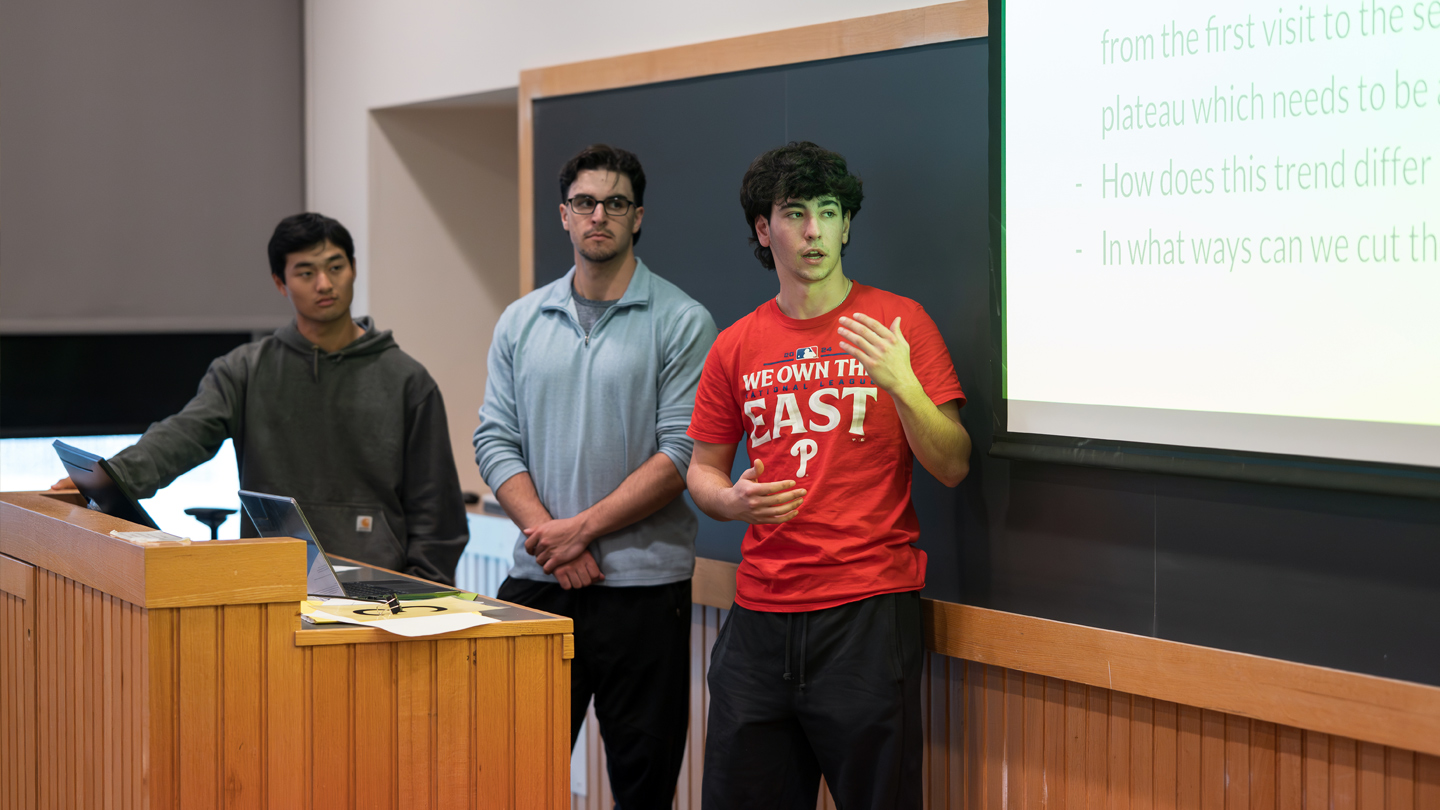
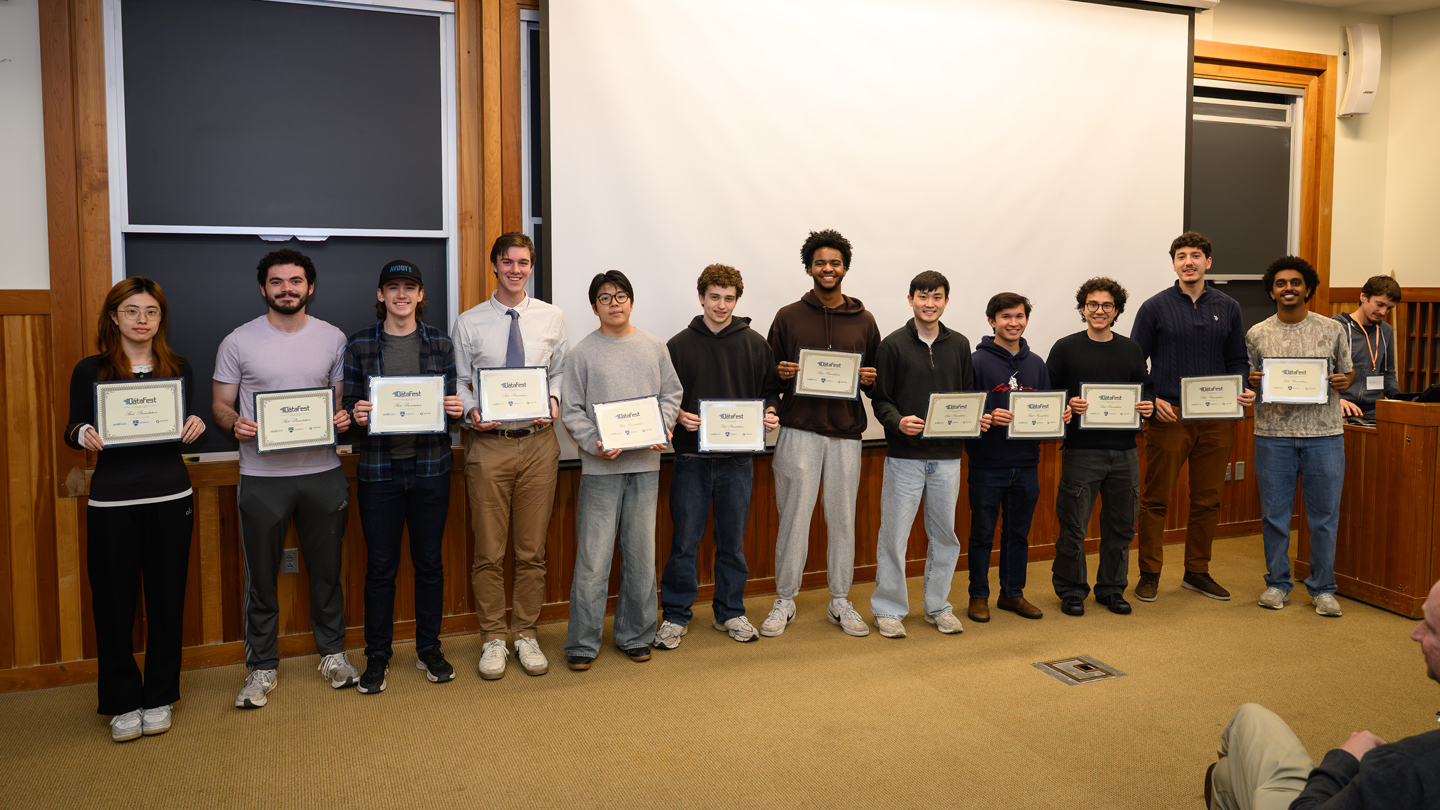
On Sunday, teams shared their results during a presentation session, and by midafternoon a team of faculty judges from across several academic disciplines decided on winners in several categories including best overall presentation, best maps, most insightful use of data, best graphs, and best use of external data.
“We had such a great time, and I’m already looking forward to doing it again next April,” said Lyford. “Hopefully students, faculty, and staff reading this will be interested in participating in the next one!”
Midd.Data is Middlebury’s interdisciplinary initiative designed to prepare all Middlebury students, regardless of major or discipline, to rigorously and critically evaluate data and data-driven arguments from a variety of perspectives, discover insights from data, form their own data-driven arguments, effectively communicate their findings, and learn and apply all of these skills in the context of their own disciplinary interests.