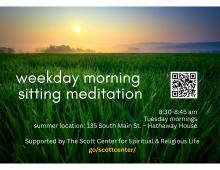
Tuesday Morning Sitting Meditation
- Sponsored by:
- Charles P. Scott Center for Spiritual and Religious Life
Faculty and staff lead Tuesday morning meditation sits during the summer. All are welcome. No registration required. Drop in any time that works for you!
Charles P. Scott Center for Spiritual and Religious Life (Hathaway House)