Chart - Pie Chart
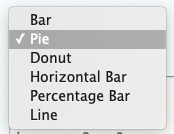
The Chart component allows editors to display data in one of several formats, including
- Bar
- Pie
- Donut
- Horizontal Bar
- Percentage Bar
- Line
To add a chart to your page, first select “Chart-Basic” from the drop-down menu under “Component type”.
Next, select the type of chart you’d like to create, in this case a Pie chart.
Once you’ve selected Pie chart, you will see this editing interface
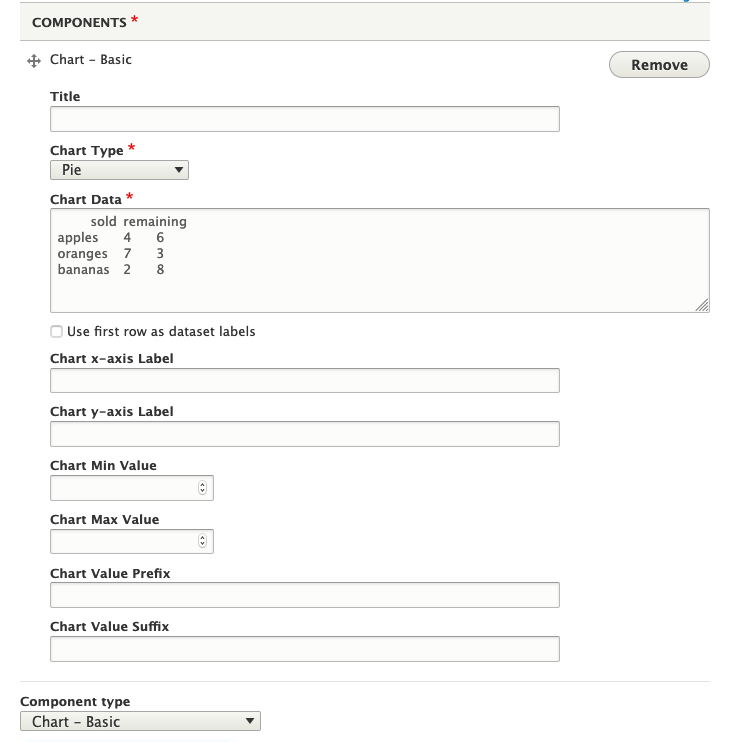
You can see there is content already populated in the “Chart Data”. This is simply to show editors how to enter data in this text editor, in this case: name-tab-number-tab-number
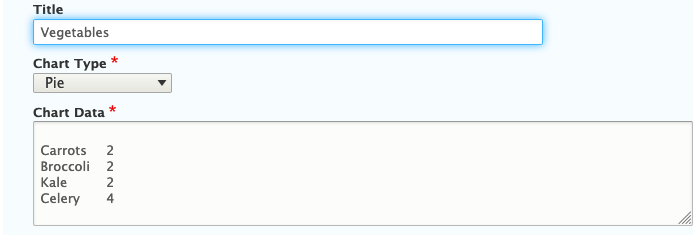
You may replace this with your own data. Further, you may give your chart a Title, though it is not required.
You will notice additional fields which may be used with other chart types including
- Chart x-axis Label
- Chart y-axis Label
- Chart Min Value
- Chart Max Value
- Chart Value Prefix
- Chart Value Suffix
When using a Pie chart, you may simple leave these fields blank.
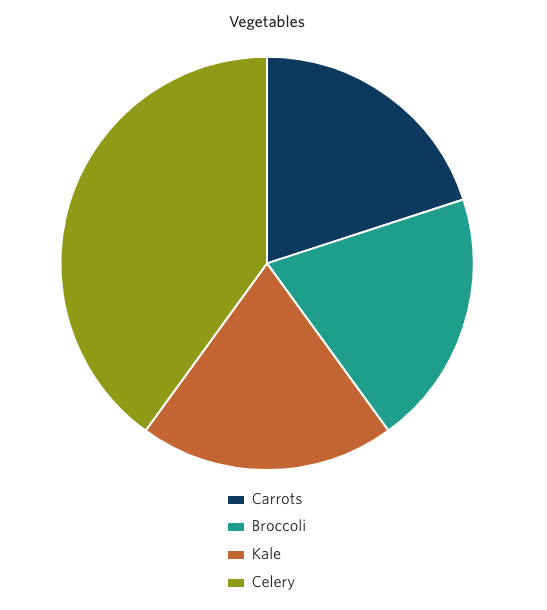
Save your work by clicking the blue “Save” button at the bottom of the page. Your Pie chart will look like this: