

Axiom Training Videos
Axiom is accessible to both Budget Office staff and to a select group of Super Users, which includes representatives from various functional areas throughout the institution. The videos below can also be found on the Axiom home page.
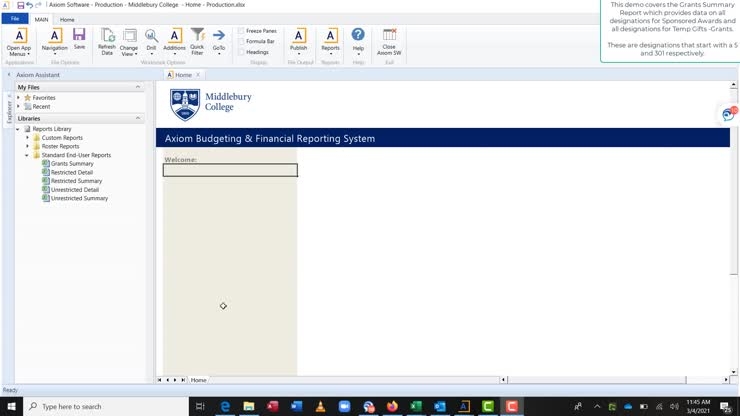
Axiom Home Page PDF’s
Axiom Intro
- [Instructor] This video provides a high-level overview of Axiom reports as well as some of the functionality available in the reports. For details on specific reports, please access those specific videos which we have created and are now located on the Axiom home page where you access this particular video. Before proceeding to those videos, you should watch this one first. Here’s the agenda. Agenda in section one, we’ll look at the Axiom launch page and the URL that you’ll need to access Axiom, as well as the home page and what Axiom will look like once you land on the home page. Section two, how to open a standard end-user report and the refresh functionality that you’ll have in order to create your report. Section three, will be how you can look within a given report. Immediately look at historical data from that same report and other change view functionality. Section four, is how you can from any of the standard end-user reports, quickly drive down to the transaction level detail and look at any specific EDORDA, or the breakdown between different departments, designations, entities. Section five are if you need to set more filters on a given report. For example, you need to see a report and only by activity code or only by particular designation. Section six is how to email a report that you’ve just created. And section seven is how to take notes and then save a given report to your hard drive.
- [Instructor] From this screen, the Axiom launch page, click on Windows Client to go into our software. Avoid clicking on the Excel Client as we will not be supporting this from Middlebury Finance. The Windows Client is much better suited for the user end experience. Click on Windows Client and on the prompt below, click open and allow the software to open. This should be the screen you see when the software opens. On this home screen, you will see a ribbon across the top of functional buttons and a report navigation panel on the left. To view the reports in the Report Library, click on the arrow to expand the library down to the folders that are available. Security is at the folder level, not the report level. If you have access to that folder, you should have access to all the reports in it. Everyone can see standard and user reports. Only a few people will have access to custom and roster reports. We will spend the majority of the time in this video on the standard end-user reports. In the Report Library, we have three folders, the Custom Reports, Roster Reports, Standard End-User Reports. In the Custom Reports, we have reports that were built to support specific areas as well as a capital expenditures report. The Roster Reports folder contains a detailed Roster Report that only few will have access to. If you have access to it and would like to learn more, please watch the video that details the Roster Report. The Standard End-User Reports folder contains five reports where the most of our work will be done. The Unrestricted Summary Report, Unrestricted Detail Report, a Restricted Summary Report, a Restricted Detail Report, as well as a Grant Summary Report Part two, Refresh Variables. When you double-click on a report to run it, it opens up a refresh variables box. This allows you to select a fiscal year, this allows you to select a fiscal period within that year, as well as a department. Now you can select from our hierarchy that corresponds to our Senior Leadership Groups at Middlebury. You can select a whole area or you can expand the area to see what rolls up underneath it. All the way down to the department level. The check box shows that it is selected to be included in the report. If you know your department number, you can search for it here. If you know your department name, you can also search for it here. Once you’ve made your selection, click okay. The refresh variables box also includes an option to add revenue actuals to the report. If your area generates revenue, select yes to see that included in the report. Also down below, there’s an include compensation actuals selection. By saying yes, it will show me the compensation costs for my area if I have access to it. Even by selecting no, I will still be able to see student wages. To go back to the parameters, you can click refresh data on the ribbon and it will allow you to reselect all of the parameters and rerun the report from right there. Part three, the Change View Button. By clicking the Change View Button, I can add historical data to the report that I’m already in. As you can see, I’ve run this for 2021 and by clicking Change View and selecting the historical box, it adds 2020 and 2019 information to the same report. You can toggle it off by clicking it here. Also under change view, by clicking object detail under the Change View button, it expands our report down to the object level. To condense the report back to its original view, click Change View object C level and then we’re back up. Section four, the drill features. By double-clicking on a value in my report, it brings up a selection box for me to drill into the GL detail drill, the charge string drill, and the door to value drills. The GL detail drill is the transaction level detail. By clicking okay, it will drill into this row of OTPS. You can see here is the 1441 that I clicked on and drilled. And here are all of the transaction-level details that make it up. Each of the columns has a filter. The Change View button in the Drill Report allows us to add descriptions to the columns that are here. By clicking on object description, it shows me the name of the object next to the code. Activity description added next to activity code. When I drilled into this report, you will see that it opened a tab across the top. I can click on the other tab that I was in and it takes me back to the report that I had originally drilled from. If I wanna drill into another portion of this report, I need to close the drill report that I have open. Again, by double-clicking, it brings up the drill prompt, and you can select it from there. In this case, we’ll try the charge string drill to see all of the charged strings that are making up this amount. Here’s our 1441 that we clicked on and we can see the individual door to charge string. I’m gonna close my drill report, go back to my original report. I’m gonna double-click and we’re gonna look at all of the designations that were used to make up this 1441. Okay. The current fund, if there were multiple designations used for these transactions, they would be listed out here. Again, I can go back to my original report here at the top. The drill functionality only works in the Standard End-User Reports. The drill functionality makes Axiom a very powerful tool for us here at Middlebury. The drill function allows us to see a very high-level number and to drill down to a very granular level very quickly and very easily. Please disregard the Drill Button on the ribbon. The double-clicking feature on the report is the best way to use the drill. Again, you must close your drill report to run another one. Part five, the Quick Filter. Well, many may not need to use this functionality. It may be necessary in rare circumstances. The Quick Filter allows you to filter that data down to a specific value or category. In this case, we’ve run an Operating Detail Report for all of Academic Affairs. After clicking on the Quick Filter button, from there click Advanced filter, and you can expand the dimensions that you wanna filter on. In this case, we’re gonna look for everything that is Department 2120. So by clicking Display Value, it shows the department values that are available for selection. I find the one that I want, click it, click the box next to it, and then say okay, this will warn you that it will refresh the data when applying the filter, say okay, this again brings up the refresh variables box, say okay. And it’s now filtered the data down to just Department 2120 or History Department. To remove the Quick Filter, down below where you can see the filter is applied, you can click the X to remove it and say okay, it’s gonna once again, prompt you that the data will be entirely refreshed. Let’s say okay. And the report will run without the filter now. Part six, emailing reports. On the ribbon along the top, select the Publish button. Under the Publish button, you can Email Workbook. By selecting Email Workbook, it brings up this prompt that will allow you to select a format for your file and then say okay. And by doing so, Axiom will automatically attach the file to an Outlook message and prepare it to be sent as an attachment. From here, you can select the recipient and send it along. The email reports function works with all reports. Part seven, snapshotting reports. On the top ribbon, selecting the Publish button, select Snapshot Workbook. And what snapshotting does is it converts this into an Excel workbook. You can see it’s added a tab here along the top, and by clicking on it, it looks largely the same. But what it allows me to do is to use some of the Excel function that is found under the home tab. It also allows me to add notes, and comments, formulas, and formatting. I can save this report as an Excel workbook. I can email it, save it to my drive, manipulate it in any way that I need to. By right-clicking on the tab, I can save it to my local drive. The snapshot functionality is very useful if you wanna save the report to your drive, or if you wanna make notes, edits to the report, or to send it along to someone else, this snapshotting of reports can be done with any of the reports. To close any report in Axiom, you can click the red X. You can choose to save it or not. You can also toggle the navigation panel with this arrow on the left. Check out some of the other videos that showcase the other reports in our library.
Unrestricted Reports
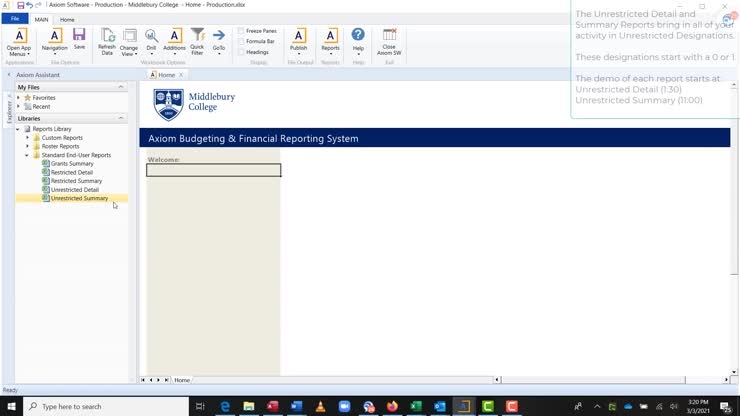
- [Instructor] So in this video, we’re gonna go over the reports in Axiom that you can utilize to view your unrestricted funds. And that is you can find these in your standard end user reports and the unrestricted detail in the unrestricted summary. I find that the unrestricted detail is very good when you know specifically which department you’re looking for and you know some of the details, but the unrestricted summary is good if you wanna view things at a higher level. Be aware that in either one of these, you can drill down to the transaction level detail from the very beginning on any line. So it’s just a matter of presentation and how they look. We’re going to go through the unrestricted summary one first and then we’ll go look at, excuse me, we’re going to go through the unrestricted detail one first, and then we’re going to go through the unrestricted summary one. So if you click on the unrestricted summary and before I even start, I just want to say the intro video that we have goes over some of the functionality in here, I’m going to go over them quickly, but this has all of the change view and historical data functionality listed in that intro. It has the ability to drill down to transactions. It has the ability to email. It has some ability to make notes and take a snapshot. It has the ability to further select filters if you need to really drill down on the specific activity or designation that you want to see. So when you click on it, you’re going to get this refresh variables pop up. You select the fiscal year. You can go back all the way to ‘17. Know that we only have transactions going back to FY20 and FY21, so you won’t get transactions for ‘19, ‘18, or ‘17. So I pick ‘21 period. It is now February. So I would pick through December, January, February pay through period eight. And here, these are at the B level, right? So each one of these correspond to a SLG member, and you can run this for any particular one. Everyone who has access to Axiom has access to view all of this. Where we put more security on is on the labor data. So if I click yes here and yes here, and look for all of college academic affairs, I’m going to get a report that looks like this. The report is going to look exactly the same, whether I do it at the B level, which is this very high level, which brings in all the departments that roll up to Academic Affairs, as it would, if I were to just pick the Physics Department. Should look exactly the same here. If at this refresh, if you want to run this because you want to send it to somebody who doesn’t usually look at compensation, you can run this without compensation actuals. And it just brings in student wages, utilities, and OTPS. From here, I’m just going to leave it here. You can click on any one of these. I can click down here. I can click here, here. I can even click over here and bring in the transaction level detail, that’s the GL detail drill. This is the most powerful part of Axiom in my mind. And you can see looking over here that there was $32,934, and you can see here, $32,934. As shown in the other video, you can change the view on here on this particular report to bring in the department description, which is if you need to, you can bring in the object description, which is probably more relevant and you can select all, and bringing in a whole bunch of data. I don’t find that very useful, but it’s available if you need it. You’re going to need to close this every time you run a drill, before you open up a new drill, otherwise it won’t let you open the second drill. So some of the other functionality. So we showed that’s the transaction level drill. If I refresh this and show this for all of Academic Affairs, again, at this time I excluded compensation from here, but I could just as easily include compensation. One of the powerful parts of this tool in my mind is you can, at this level, not just look at the transactions like we did before. If I click on here, I would get hundreds of rows that equal $2.9 million. But I can look at this to say, okay, I want to see how I’m spending that $2.9 million across all of the departments. And so here’s the budget, or here’s the actuals 2.9, and here are the budgets and here’s the variance. So you can very quickly see who’s over and under spent on their OTPS. And you can do that at any line. You can do that for student wages. Now this view here is very high level. So there are a whole bunch of objects that have been consolidated into here. There’s a whole bunch of objects that have been consolidated into here and into here. With a click of a button is change view. You can bring in all the objects, right? So here are all the OTPS objects. If you want to find out, and again, each one of these are drillable. So I could go down to the transaction level detail. I could even see at this level, again, by department or by designation. The other thing that is available is this historical, which will bring in, the only thing that is available is the historical data, which brings in how you were doing for the last two years through the period eight that you ran this report for as well as the end of the year. So this is a good means to see if I change the view, object to see level to see, okay, in the last four months of last year, they spent this entire area. Academic Affairs spent $1.1 million. They have $1.3 million left this year. So they’re pretty much, they’re on track at a global level. If you wanted to see the details regarding how they’re doing on a department by department basis, again, you can just very quickly go department drill and it’ll just bring up the first year. But even on the drills, you can look at the historical. So that same data that’s over here. So you can see here’s this year’s budget and this year’s actuals and last year’s actuals. You can see that same data here on a department by department basis. If you want to view this, I go here and I say okay, I want to see this by designation, total operating expenditures. And I’m just going to choose one of these. And you say faculty startup 110025. I can, if I want to just view this entire financial statement for just Designation 110025, I can go to this quick filter. You’re gonna need to make sure that it says Advanced, not Simple, type in Designation here. Click on here. 110025. I believe that was what we were looking for. There it is, click okay. Run it again. Sometimes if you have a big report and then you run a smaller report, it looks like it’s blank, you just need to scroll up. So if I go here, there’s the 326 that was spent through on Designation 110025. And now with that quick filter, I can see that 326093 number and how it was spent. So that’s a quick look at the Unrestricted Detail Report. Like all the reports within Axiom, you can quickly email it and you can quickly take a snapshot by taking a snapshot. This is a great tool. If you want to send this to somebody and you want to put a note in here, and at this point, you can insert a comment or change this and say, look at this number. And then with this tab open, go back to main and I hit email workbook and it will send this workbook to whoever you want. Now I’m going to go on to the Unrestricted Summary Report. The Unrestricted Summary Report is almost exactly the same as the Unrestricted Detail Report, frankly, they’re interchangeable. And it’s just a matter of which one you prefer to use, but I’m going to look at this again by Academic Affairs, all of Academic Affairs. And again, what this one enables you to do is look at all of Academic Affairs at a more summarized level and not necessarily at a P&L income statement basis. So for this one, the revenue comes in here, the expense comes in over here. The variance is available, again, like the Detail Report, any one of these, you double-click on it, GL detail drill, and you’ll get all of the GL detail. Keep in mind that the transaction level detail is for the entire row and not for the cell that you click on. So you can also bring in historical data. I find this a little hard to look at, but it’s there if you need it and you want to see it. The thing I do like about this is this has an extra feature that the other one does not have when you’re summarizing. So this was just looking at it on a department by department basis. But even on this, you can say, okay, I want to see this by department and then by object. So you have this summarized version of objects for each department. And again, each one of these, this line is clickable. Any line is clickable here, double-click on it. And you can go down to the transaction level detail, or you can say, I want to see this on an object for every single object, not just that summarized version of objects. You can do this by department and designation. And since this is unrestricted, it’s no surprise that most of these are 0000, but there are some other designations that do pop up. Again, Unrestricted Reports are just going to bring in designations that start with a 01. There are some oddball cases of some designations that start with a three, but there are only a handful of those, one or two or three of those. But the majority of you do not need to worry about. And with this tool it would be very easy to find because they will be coming into this unrestricted summary or Unrestricted Detail Report. And that’s the Unrestricted Summary Report, has the same functionality, quick filter as well, change view, historical transactions, emailing and snapshot. Thanks.
Restricted Reports
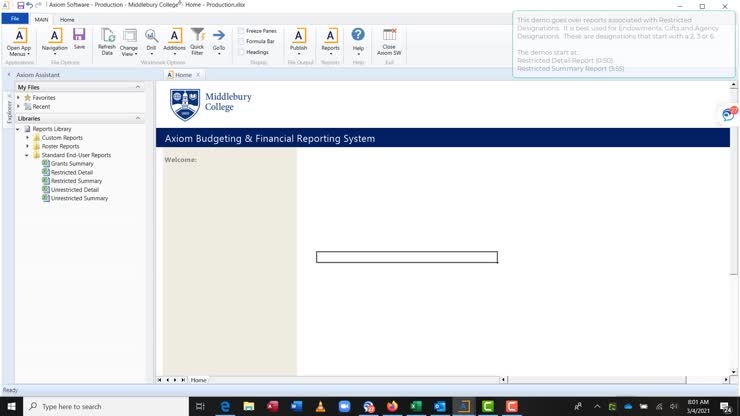
- Following is a demonstration of reports in Axiom associated with restricted designations. So, like the Unrestricted Designation Reports, there are two Restricted Designation Reports. There’s the Detail Report and the Summary Report. We’ll be going through the Detail Report first and then the Summary Report. They are very similar to the Unrestricted Detail Report and Summary Report, I find that the Restricted Detail Report is best when you know, the exact designation that you’re looking for. And the summary is when you want to see a whole bunch of designations, whether gifts or endowments, broken out by a given SLG member or a given department. So I’m gonna open up restricted detail. And again, like the unrestricted, you pick your year, 21, you pick the year that your, the period that you want to look through. So, let’s go through period eight, which would be through February. And you can choose what type you want here. It’s optional. I’d find this to be not that useful, again, because I generally use this to just find a individual endowment or, or gift. But then I can go here and again, you can see here, this is listed by SLG member, all right, or SLG area. But, when you break it down and you go down to the further levels, instead of being by department, it’s actually by designation. So these are all the designations that roll up to the Academic Affairs area, all right. So, these are ones who the designation owner is someone who eventually rolls up under Sujata, right, in the Academic Affairs. So I’m gonna pick one that I know of. CV Starr endowment, and here you can see it looks just like the Unrestricted Detail Report, except it has, this is for the unrestricted, this is for the CV Starr designation. You can see all the way down at the bottom it can tell you what the ending net assets were, right. So it had an accumulated balance as the end of 2020 536. If you take that 536, and then you take the revenue that has been, that has generated over this past year, less the expenses over this past year, you’re left with 794, which is the current net asset balance. But you can see here what the previous ending net asset balances were for this particular endowment. Like, the Unrestricted Detail Report has the same exact functionality. You can look at historical. You can look at object details. So each one of those roll-ups at the individual detail level and every single line here, again, you can go down to the transaction level. You can go down to the, you can break this out to see what the actual departments were, or you can see the actual EDORDA. I’m not gonna go into the detail of those because those are all in the Unrestricted Report demo, as well as the intro demo. And similarly, it’s got the functionality where you can look, you can send it by email, you can take another snapshot of this. And it creates something that says snapshot. You can take notes and then you can use the email function to send it to somebody. So that’s it. That is the Restricted Detail Report. Now onto the Restricted Summary Report, and again, pick your fiscal year. You pick it through the period you want to view, so I’m picking through February. This one, I do actually find to be useful, if I want to find all of the gifts that roll up to within Academic Affairs, now, and again, so it will bring in all of these designations down here that are gifts, right. So, it, you know, everything that starts with a two is an endowment, but it’s obviously not a gift. And since you have already picked the filter that says gifts, it’ll bring in every gift. And like the unrestricted summary, you have different ways to look at this, right. So there’s the highest level is just by designation and like the Unrestricted Detail Report or Summary Report, revenues over here, expenses are over here. However, this has the added benefit of bringing in net assets, as well. Right. And these net assets will tie to the Restricted Detail Report net assets that you see. So you can see all of, all of these. You can, and again, every single one of these lines, you can, you can double click on any one of these lines, get the details, get the transactions, get the chart strings, see the departments that these roll up into. Now, be aware that the department that it rolls up to, or not the department that it rolls up to, but the departments that you get might not just be the ones that are in Academic Affairs, because it’s the endowment that rolls up to academic affairs. It still might be charged to some other department that is outside of Academic Affairs that you’ll see here. All right. So, this is at the highest level, right. But again, you can get very quickly down to the transaction level, by double clicking. If I refresh data, I can then see every single one of these by object. This is the one that I find most useful. All right. So you can see here this particular gift, all right, or this particular gift. You can see the gift revenue is on this side and the salaries are on this side, or excuse me, the expenses are on this side. Again, everything is, you can, you can drill in. Now again, if I wanted to see all the endowments that rolled up to a particular area, I can just change this from gifts to endowments. And have it like that. Again, format, doesn’t change. Revenue over here, expense over here, net asset over here. Every line is drillable. You can use, you can use the quick filter. You can email the report. You can take a snapshot exactly the same as the Unrestricted Summary Report and exact same functionality that all of those other reports have as well. That’s it.
Roster Report
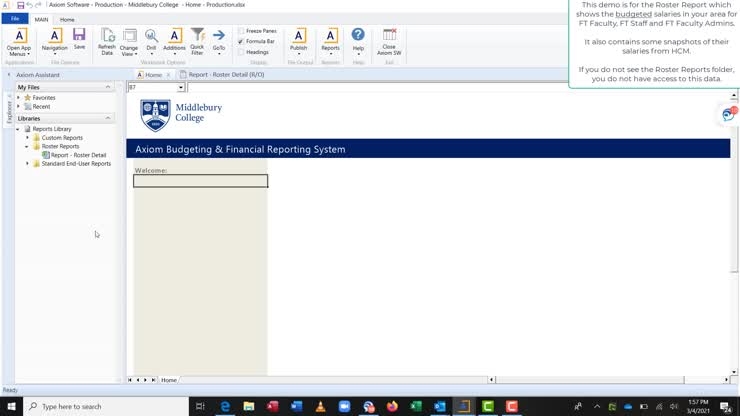
- Welcome to the demo on the Labor Report that we have, or Roster Report that we have within Axiom. If, you can only get to this report if you see this folder right here that’s called “Roster Reports” and you will only see that folder if you have access to labor, if you don’t see that folder, then it means you don’t have access to labor data and you don’t need to watch this video. But just like all the other reports, you can double-click on it and when you double-click on it, I’ve already opened it, it’s right over here, you would get a pop-up. Let’s disregard this HCM snapshot for a second, I’ll bring that, I’ll talk about that in a second. So, this person that I’ve brought up has access just to those departments that are Academic Affairs, all right? So, if I clicked on that choose your department, you can see it brings up all of them, right? But this person only has access to those that are under Academic Affairs. All of the access that we have is only at the B level, so if you have access to labor, you will have access to all the data, either under College Admissions, under Advancement, under Bread Loaf, under Communications and Marketing. In this case, this person has all the access under Academic Affairs to see all the data. So, if this particular person went in here and said, “Hey, I’m interested in seeing what’s in Admissions,” and clicked okay, they would get a blank report. On the converse, and this is a quick way to see what you actually have access to in Axiom, for labor data, if you just left that blank, since it’s optional, and clicked okay, it would bring in, this person is only Academic Affairs. If I scroll all the way to the bottom, all of these departments are in Academic Affairs. So, let’s go back to this refresh data. Again, we’re gonna come back to this. Let’s say this particular person is just interested in the History Department. And we’re gonna choose two of them, 2109 and 2120. They can choose, actually, let’s hold on to that for a second, we’ll come back to that. But on the object, these are the only positions that are coming into Axiom for the roster data. And the roster data is what impacts your budget, and you can see it’s bringing in objects 50,000, 50,100, and 50,102. I could sort this to just look at 50,000, 50,100, and 50,102 or I could just hit Cancel and just say, “Just bring me everything that’s in those three objects regardless of designation, just bring ‘em in.” And you run it, and here it is, you can see it’s sorted this, so that there’s only 2109 and 2120. And you can see over here, it brings in the name, it brings in the position, it brings in the employee number and the assignment number, it brings in the objects, so you can see that there are multiple objects in here. And it brings in all the designations, and you can see there are multiple designations in here. It brings in the budget, here. Disregard this for the time being. And then it brings in, I’ll expand this, it brings in the budget, the planned budget for the subsequent year. Now, I didn’t bring in HCM snapshot before since it was optional. And therefore, this is completely blank. Now, note these numbers here aren’t really numbers, these are just symbols. When you run this report, you will see the numbers, I’ve just done this to make this anonymous since it is a public video. However, this ribbon apparently means zero, since we’re not bringing in any snapshots. But I could choose to bring in a snapshot, so this is a payroll snapshot of what people, what their salaries were on a given day, all right. So, this is a snapshot as of November, this is a snapshot as of January 22nd, and this is a snapshot as of February 18th. Again, I’m just gonna bring it in for 2109 and 21, what was that? 2120. And this time, let’s add just one of everything that’s unrestricted. And this time, I just want faculty salaries. Okay, so, first thing, you’ll see here, all of these are just 50,000, like I’ve chosen, all of these are Designation 0000, or any other unrestricted designation. And that HCM snapshot has brought in the data of what that person was paid on 2/18, or not what they were paid, but what their salary was as of 2/18, on February 18th. Note that if you see two people here, or the name, the same name of someone on two separate rows, it’s because they have two separate jobs, all right? Or multiple jobs within HCM. Again, these right here, these ribbons, denote that there’s a variance of zero. So, what their salary was is the same as what they were budgeted for, okay. This is important, so the reason I bring this up, this column here, if we’ve done this right, when we look at a particular department 2120, and let’s call it object 50,000 or any one of these objects. The total faculty salary in object 50,000 in history was 1,556,000. If we go to the Unrestricted Detail Report, or even the Summary Report to look for that particular object and that particular department, it should be 1,556,962. So, here it is, however, remember this is aggregated together. So, I’m gonna wanna look at the object, object detail. And there it is. Department 2120, object 50,000, and there is the salary. So, the last item I wanna bring up on this particular report, or last two items, you can always tell what the report was that you ran by looking right here, it shows you all the filters. And there’s also this report over here, right? And this is a good report, or this is the same report, it’s the same exact data, except it’s in a format that, if you want to take a snapshot, right, and again you can take a snapshot or you can email it to yourself. If you want to take a snapshot, you can then do a bunch of things here like use these filter buttons to sort the table that you’ve brought in. This is a good feature, this is a good particular one when you need to run this report at a very high level, but then you wanna do a lot of manipulation of the data. This over here is a very good report if you just want to send it to somebody. And that’s it.
Grants Report
- [Instructor] Hi. The following is a demo of the Grant Summary Report. Unlike the Restricted Detail or the Restricted Reports in the Unrestricted Reports, there’s only one Grants Report. We had to create a separate one for grants and we have another one coming out for capital expenditures. But for grants, the reason we have a separate one is because these are multi-year views of, of grants, and you need to see what the accumulated revenue and the cumulated expenses have been over the course of that grant. Right, so, however, similarly to the other ones, you just double click on it. You click on the Fiscal Year and the year or the period through which you want it. In this case, I want it through February. It automatically defaults to All Sponsored Awards and Temp Gift Grants. However, if you just want to see Sponsored Awards, just click on there. But most of the time, if you know the specific grant or, or that you want, you just leave it, you just leave it like this. Then you go to here and again, this is listed by SLG member area. But as you go down into it, you can see that at the base level it’s by Designation. Right? So, here are all the Designations that roll up to CNS in this case. Okay? If I want to see all of the Sponsored Awards and Temp Gifts, that roll up to all of the Institute. I just click on as I did, and I can view this by Designation or Designation and Object. And I can also include or exclude revenue from the report. Now this is a big report. So I, it took about a minute to run, but I’ve edited it out of the video. And so at the highest level this shows you every single designation, the summary of their revenue, a summary of their expenses, and the nets, over the entire period. Right? And this was a big long report because, if you look, there are quite a few Designations that are listed here. I go to scroll to the top. So this, just like all the other reports you can double click, you can get down to the transaction, you can see every single chart strain, you can see the departments that this rolls up to. Right? Note that - this is very important. When I drilled the transaction - it’s only going to go back to FY20. Right? Even if there are values for FY19, 18, and 17, we have only brought transactions from FY20 and early - or FY20 and 21 into the system because the previous all reside in Banner. But now I’m drilling in to Transactions and here you can see the Transactions that I just drilled into. I just drilled into this row here and it’s bringing in all the Transactions. You can see the Transactions that was in 20 and the ones that were in 21. I wanna see the Expenditures to Transactions. Let me click on the Expenditures, and here’s the 84,000. If I want to see both, I’d click on that one. And there’s the 54 revenue and the 84. I want to see this by year, I could further filter like that. Just see what’s in 2021, versus what’s in 2020. The other way you can run this is, so this is pulling in all of the institutes. I’m just going to narrow this down a little bit, so it doesn’t take so long to run. So I’m just going to look at the ones in CNS. I could just say, okay, instead of bringing me All Sponsored Awards and Temp Gifts and Grants, I could just choose one or the others. But more importantly, this View By I think is probably the better way to think about this. You can just bring in the Designation and rather than just say Revenue and Expenses, you can bring in a summary level of the Revenue Expenses. So you can see how many are salaries, what are benefits, what are student wages, what’s OTPs, and what’s indirect. So here you can see now, all the different expense lines. That add up to this, this line here, and you can see that this is $186,000, and that’s the same. Now, again, all of these lines are drillable. Finally, if I just want to run this for one particular designation I can do that as well. I can say, I want to run this for 5, 1. And there you have it.
Introduction to Utility–Report Distribution
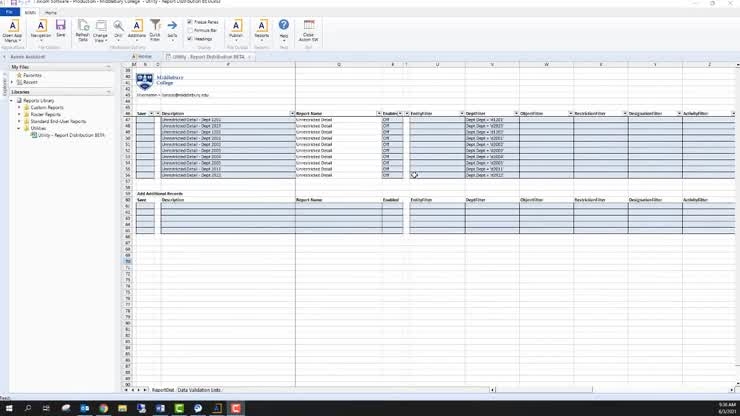
- [Instructor] Hello, today we are going to review the Utility Report Distribution Tool. If you have access to this tool, once you log into Axiom, under your Reports Library, you will see Utilities folder. And within that Utilities folder, the Report Distribution Utility will be available to you. To give you a little bit of a concept of what this tool is designed to do, it will allow you to take your existing lines and distribute specific reports into your SharePoint folders. With this tool will allow you to modify existing lines as well as add new lines, and you will be able to send out Axiom reports into your designated share folders that you would have set up with the Budget Office. The next piece I want to address is general Axiom functionality. As with any report, you have the ribbon on top. The Refresh button allows you to refresh the data. The Change View button allows you to hide and unhide certain columns. In this case, we only have the Report DistID, is an auto-generated detail within our tools, so in our instance, you do not need to worry about it, but you do have the option to view it. Each line will have a unique ID, or what we call a key, here. In addition, you will notice that the report has some blue highlighted lines, as well as some white lines. The blue highlighted lines are data inputs. The blue items you are required to fill in, so that the report will function. The white ones, in this case, we only have one, you cannot modify. The Save Toggle button on the left here, in column N, is a little different from your Save button on top. What this requires you to do is select Save before you make any changes to any of the lines. If Save is not selected and a line is changed, for example, I want to add, change the name on here, and I want to turn this to on, if I do not select the Save button, it will not take the data in. And I can demonstrate that by hitting Save up here. It’s gonna tell me that zero records were saved and updated. And as you can see, this is the case right here. Now, if I refresh my data, and if I go through that process one more time, but actually have the Save button selected, and change this to on. And now when I hit Save, Axiom will know to take this data and actually record it to a table, which in this case it should tell me that one line has been updated. One record has been updated, zero inserted, zero saved. Now when I hit refresh, the changes are still there. Again, in order to eliminate this, and set it back the way it was, I will simply remove the lead and hit select Save, and hit Save one more time. Again, we should see one record updated and the information will be as displayed. To refresh, and here we are. Let’s discuss the enable On-Off button in more details. What this toggle allows you to do is actually set the reports that you do want distributed in your share folder. Any report that you want distributed would need to be selected to on at the beginning of the month. If you do not want certain reports distributed, you can simply have them set to all. One piece of information to note is that you, as the user, will not be physically pushing these reports onto share drive. That is something that the Budget Office will do at the beginning of each month, once the month has been closed from the accounting side. In order to have that functioning correctly, you would have to go here and select any on-off details that you want. So keep in mind if you need to make any adjustments to your reports or to your distribution, it should be done before the beginning of the month, so that they do take effect when the next distribution rolls out. Again, the distributions will be done on a monthly basis, at the beginning of the month, and that push will happen by the Budget Office. Now, before we take a deeper dive into the tool itself, I want to point out the Axiom Filter Wizard will be used to adjust your EDORDA details. So if you need to filter a specific report more than just on the department, if you need to filter it further down by Object, Entity, Restriction, and so on, you will need to use the Filter Wizard The way the Filter Wizard works is you, in this case, let’s say I need to change the Entity, I would right-click on that particular cell, go down to Axiom Wizard and hit the Filter Wizard. Once the Filter Wizard opens, you want to make sure that you are in Simple Filter and not Advanced Filter. Advanced Filter looks at this. You simply need to click on this to be in Simple Filter Wizard. The dimension, since EDORDA is a dimension, you will always be in the dimensions folder. In this case, I’m trying to change the Entity. So I will drop down and go to Entity, select it, and now what this will allow me to do, I can simply select one Entity. I can select multiple entities. And click Apply and Okay. Or I can also exclude certain entities. So if I go on here, dimension, and hit Entity again, I can say, I want all the entities, but to exclude schools. So in this case, the report is gonna filter on everything, but not including 313 in this one. Further, the same works exactly with the object filter. Once in Axiom Wizard, I will go in Dimension, down to Object, and I can simply search for my objects here, if I know them, or look through the list. If I want Travel, I can say, I want these two equals to these two. Hit Apply, or on this next report, I can say that I want everything but Travel. So I’m gonna say does not equal and type in the word Travel, and say anything that has the word Travel in it, any object, I do not want part for my report. And that is how you’ve use Filter Wizard. Now to quickly touch base on SharePoint folders and how they are set up. In order to send your Distribution Report to a SharePoint folder, you will actually need to know the path or the layout of your particular folder. That is entered in column AD. And all the designation paths start with the same preset, which is written on top here. And then thereafter, you simply follow your B-level structure, based on any layout that you have selected. In this case, we’re working with the Provost’s Office. So we’re the B-level Provost Office. And then their next layout is the immediate folder structure thereafter. This is something you would have set with the Budget Office initially. And we do have a separate video walking you through how to access SharePoint and how to manage and adjust any SharePoint details. So to give you a quick overview of what SharePoint looks like, SharePoint lives in the Cloud, and it is on our OneDrive. And if you look at it, all of the top level starts with the hierarchy layout. And in some cases, as in the Provost Office, we go from the B-level directly down to the lowest department folder structures. In other cases, we go from the B-level down to the C-level, and then to a particular folder structures. Again, you will need to be familiar with your specific layout of what you would have selected. And again, we have a video that shows you how to get in here, how to make modifications, how to give your end users access, to keep this well-maintained and updated. Now, I will actually show you how to use the tool. You have two aspects to the tool. One of them will show you what the particular existing lines are for a user, in this case, the Provost Office. And the second piece of the report allows you to add a new line or a new record to be distributed. You can modify and change existing lines with the top section, and the bottom section we use to add new lines. So let’s go through and modify a couple of these. So in this first case, let’s say, I want to rename this, and I want to toggle it to On, because during the next distribution, I want this report to be sent to Department 1201. But further, I want to filter this one by Entity. And I’m gonna say, I want to include all the entities except the schools. In this case, I will select does not equal schools. Hit Apply. And again, I want to filter this only on objects that contain the word Supplies. And I will select all of these and hit Okay. Now for me to save this, I simply have to hit Save and click the Save button. And this will tell me that one record was updated. And here we can see our record has been updated with the new name, it is toggled to On, meaning that it will be distributed the next time the report distributions at the beginning of the month occur. We’re filtering on everything, but excluding 313. We’re using Department 1201, and including only these objects. This is an Unrestricted Detail Report. And the Unrestricted Detail Report will be sent to our B Provost Office, 1201 Academic Development folder. Now, in order to remove all this, I would simply delete all the details up top, and hit the Save button. Let’s go ahead and add a new record. I’m gonna start by toggling Save. I’m just gonna call this one test, and the description can be whatever you like it to be. My report name, in this case, I’m gonna use the Restricted Summary Report. And I want this report, again, to be distributed by the distribution that’s at the beginning of the month. And I want to enter this into Department 2922. Now, if your department’s already selected on here, you can simply copy and paste information, or go through the Axiom Wizard if you do not know the specific language. I always recommend using the Axiom Wizard, but this is sort of a shortcut. I do not want to limit it on anything, but to point out, there is a view selection in here. The view selection is only specific to the Restricted Summary and the Unrestricted Summary Reports. Since we have selected the Restricted Summary Report, I want this to be by Designation. And it tells you right here that the Restricted Summary has four selections, and the Unrestricted Summary has also four selections. So in this case, if I wanted by Designation, I will simply type Designation in here. To quickly expand on this view a little further, if we go back in here and look at our Unrestricted Summary and the Restricted Summary, this is that view that’s been addressed. So on your refresh variables, you can select between these four toggle items. And we’re selecting designation in here. The folder path, since I’m using 2922, I can simply copy the information or type it in. In order to copy this, you should note that this is a formula, so we can’t simply click copy and paste because you will not get any output, the output will be the actual formula in here. So in order to avoid that, you would have to copy and then right-click and paste special. And you want to pay special values, and then hit Okay. One detail to point out here, once you are writing these out, you have to be extremely familiar with your SharePoint folder structure. Because you want to type it out exactly as it is written and the way it sits in your SharePoint folder structure. If you by any chance and enter a space in here by mistake or add another space or add an S, but that is not how your SharePoint folder structure is set up, this distribution, when it runs in the beginning of the month, it will not fail. What it will do is create a new folder under the B Provost Office with the spacing and the extra S. Now your report will end up in that new folder, and none of your end users will have access to that end folder. So you really need to pay attention to the specific wording in how your SharePoint is set up, in order to distribute the report in there correctly. Otherwise, if you’re not checking this and paying attention, you will physically be altering your SharePoint structure, which can cause quite some confusion down the road. So in this case, let’s leave it the way it should be. And once I have all this laid out, I can hit the Save button, and it will tell me that one record was inserted. After hitting refresh, we will see up here we still have our old record that was modified, and we have our new record that was added. Thank you for your time. In order to learn how to manage SharePoint folders, as well as other essential parts of the report distribution, please go back to the Axiom homepage. The Axiom homepage will have a list of new videos and material available for you to review.
Introduction to Payroll Summary Report
- Greetings, welcome to the demonstration of the Payroll Summary Report in Axiom. From here, we’ll click Windows client, and move into our Axiom model. On the left, in our report library, you will see the Roster Reports. By clicking on this folder, you will see three reports underneath it. Today we’ll be discussing the Payroll Summary Report. It says beta, but that name will change to just payroll summary. If you do not see the Roster Reports folder, it’s because you do not have access to labor data. Double-click on the Payroll Summary Beta Report. A refresh variables box opens to allow you to select some parameters, to run the report. Select your fiscal year, select which period through the fiscal year you want to see, select the department that you would like, And depending on your access, you will only be able to run data for the area that you have access to. For this case, the access is limited to Academic Affairs. So by selecting Academic Affairs, I can drill down into the tree and select lower levels from there all the way down to the department level. Select the level that you’d like to report at, and in this case, I will stay at the top of Academic Affairs. Say okay. Designation type is the next selection in the parameters. This is a type of funding source. If you’d like to limit your data down to one of these specific sources, make that selection here. It is optional. Designation owner. Also, it’s the tree, of where each of the designations roll up to. This is also an optional selection. And at the bottom you can select which of the compensation object numbers that you would like to see the report run on. If you don’t select any of them, it will give you all of them or any data on them. So in this case, I’m going to leave it blank. So we see all of them. I’m gonna say okay, and let the data present. For our training purposes, We have changed our dollar amounts to wingdings. When you run this report yourself in production, you will see the dollar amounts. So once in the report, like a lot of the other reports in Axiom, you can come up to refresh data and you can change your parameters. So this is the default view, and you can see that it starts with an employee last name an employee first name, the state in which they work, the EDORDA information. We can see a position number, an assignment number, an assignment name, and a year-to-date total. This isn’t a report you can drill on, by selecting the Change View button, you can add different columns of data to the report that you have right here. So we can see that we can add each of the EDORDA descriptions. So if I add the department description, you can see it populates it here next to the department number. Also under change view down towards the bottom here, I can add different HCM-related information for each of the employees, right? We can see their individual FTE, their assignment category, whether they’re part-time, full-time. Their home department and employee personnel type, whether they’re faculty, staff, student, and we can toggle all of those columns on and off as we want to here. The most powerful selection on this Change View button is the Pay Periods. And by selecting Pay Periods right at the top, you see it adds our 1 through 26 Pay Periods as columns. And we can see at the top of each of the columns, there is a filter that we can use to filter this data down. Let’s say we were looking for an individual person. We could filter this on a singular person, and we’re seeing our totals at the top for Vermont and California separately, and then together, right? And we’re seeing those by payroll across by pay period, going across, we’re seeing the date of the pay period, and we’re seeing when in the year did it run so we can see, for example, payroll pay period nine ran in our fifth fiscal period, right? Again, our, our Middlebury College fiscal year starts in July and ends June 30th, right? So right now we just started our twelfth month, twelfth fiscal period being June. So those payroll periods have not run yet, which is why we don’t see data here. Okay? This is all actual data, right from our payroll runs. There is no budget information on this report. Again this isn’t a report that you can drill into, but it’s dynamic enough where you can sort with the filters and the Change View button to really be very insightful. Along the top, our functional ribbon is largely the same as it operates in the other reports under publish, if I want to email this report, I can click Email Workbook. It will attach it to an Outlook email, and I can send it off, send it to myself. If I want to save a copy of it, snapshot workbook, right? This works the same as it does with all the other reports. It creates an Excel formatted version of the report. Identical how you have it run originally here on the screen. And from there you can right-click and save it to your drive. So very familiar functionality as the other reports. Couple of final things to note, you’ll see this red text here stating the following is Vermont payroll data. California and Language School payroll data begins at row 3,123. So we’re just going to jump down there so that you can see that looks like and how the data is separated. Again, there’s a lot of data here because they ran it for all of Academic Affairs. It’s set up alphabetized by person and then by state. So the top portion of the data is Vermont. Like the note states, and then the lower portion here is the California activity, as it would pertain to Academic Affairs. And again, we can go across and see our EDORDA information, our position and assignment, assignment name, year-to-date totals, and then our individual payroll runs. Again, this report can be found under the Roster Reports folder in the Reports Library. Thank you.
Accessing Sharepoint
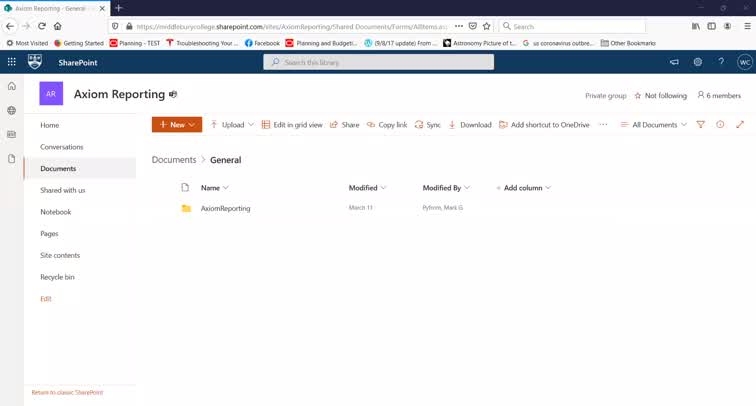
- [Instructor] In this video, we are going to take a quick look at how to access your Axiom reports as they will show up in OneDrive on SharePoint, which is where they will be distributed to you on a monthly basis or whatever basis the managers in your area decide that they should come out on. So there are two principle ways to get to SharePoint quickly. One is to use the following URL. This will be provided to you in written instructions as well. So you don’t need to catch it from here, but it’s go.middlebury.edu/onedrive. And as you can see, that gets you to the OneDrive Directory. As you can see here, the other URL that you can use, which will get you to the exact same place is Middleburycollege-my.sharepoint.com. Again these will be provided to you so you don’t need to catch them here from the video, but we just wanted to give you a visual example of what it looks like. And as you can see, this gets you to exactly the same place. You’ll see your files on OneDrive, and what you want to do when you get here for the first time is go to Shared and under Shared, you will see files and folders that have been specifically shared with you. In your case what you will see is you will see the department folders for the monthly financial reports that you will be receiving. And I am on the administrator side. So I already have access to the entire directory. So I don’t see anything directly under shared with me here, but we can take a quick look at what this will look like for you, depending on your individual areas, but we’ll use Language Schools as an example. When you click on Shared, after these reporting folders have been shared with you, you will see a list of whichever departments you have access to. So you wouldn’t see this entire list necessarily, but you might see one or two from it, for you whatever departments are in your area. And the nomenclature here is a lowercase the department number a dash and the department name. And if you click on an individual folder, you would then find the monthly reports as they’ve been distributed under that folder, the managers in your area can provide further training on what is in those reports and you know, what data they show, how to read them, that kind of thing. But we’re just showing you how to get to them. That’s our main goal for today. Two other things to quickly note, if you do want to, you know, kind of get this to be more accessible, the next time you come in, one way you can do that is you can add shortcuts. So you’ll see this item in your menu and it looks like I’ve already added this shortcut, but it’s a matter of clicking the Add shortcut. And then once you’ve done that, what will happen the next time you log in and go to my files, you will see the shortcut that you’ve just created. So you can go directly to the folder. If it’s something that you need to access quickly. And you’ll see if you click on that, you will then see the individual reports. The other thing you can do again for a future fast access, yes you can add it to your favorites and we’re in Microsoft Edge as an example, but which is the recommended browser that our IT Department supports, but most browsers will have the same function, which is they’ll have some kind of Add to favorites and you could call this anything you wanted. It’s a descriptor that you can fill in to, for your future reference. So it should be something that you’ll kind of recognize in my case, this seems straightforward enough to me. So I’m going to click Done. And now that I’ve added that to favorites in the future, the next time I logged in, for instance, I could go under Favorites and I would see this link that I just added, which will take me directly back to these reports. So these are the main features that we wanted to show you quickly, just in terms of how to get to SharePoint, how to find your reports in the folders in SharePoint, and what to do to kind of bookmark or get fast access to these reports. The users in your area will be providing additional training to you on this, and you will have written materials to refer to as well. Thank you.
Managing Sharepoint Folder Security and Maintenance
- [Instructor] In this video, we’re going to cover how to set up new folders in SharePoint for receiving reports from Axiom, as those reports are periodically distributed from Axiom and also how to maintain the security of those folders in terms of people’s access and removing people. So as a first step, we’re in SharePoint now, and I’m going to click on Axiom Reporting. When I do this, because I’m a system administrator, I see all of the folders for all of the areas. When you do it, you will only see those folders that you’re responsible for overseeing, but we’ll look at one of these as an example. If you wanted to create a new folder in this area, it’s simply a matter of going up to the menu up here and choosing folder under new. This will give you a chance to set up the name for your folder. If it’s a department, it’s a good idea to have it have the same nomenclature as the other departments so that we can easily link it back and forth to Axiom. So that will be letter D, the department number, space, dash, space, and the department name. I always forget to capitalize that at all. So you’ll see now, having just added this department, you will find it here at the bottom of your screen. In order to set up security for this department, hover over our department name that you want to set up security for, and look for these three dots in the center. This will give you a menu. And from that menu, you will want to choose Share. The first thing you’ll see under share is this cursor here, which indicates the kind of access you wanna give, you can either give view or edit. View allows the user to see what’s in the folder, open it up, look at it, but not make changes to the folder itself, so they can’t add new items into the folder, they can’t delete something that’s in the folder. They can just open up and view something that’s already there. For most of your users in most of your areas can view will be the most appropriate. So to find the person, you can enter any part of their first name, last name or email in this field here, and it will then look them up in the directory. You can choose the person you want. At this stage, you want to press copy link, and close. So having done this, if you go into the folder security now and go under manage access, you will find this area in the menu, links giving access, and then people you’ve specified who can view and you’ll find the new person that you just added. You don’t actually have to do this step each time you add someone, this was just to show you that the access has appeared and how to check who has access. So what you’ve done at this point is you have given the person you want to have access the kind of access you want them to have. You haven’t actually notified them or sent them a link that will allow them to easily navigate to their folder. So to do that, go back to this again, for any department you wanna do this for, hover over it and look for this menu in the center, go back to share, and again, look up the person’s name, Choose the person, and this time you want to click send. And what this has done is it’s sent out a system generated email to the user, which they can then click on and it will have a link that they can click on and will send them directly to their folder in SharePoint and will also enable them to access that folder going forward, they’ll see it among recent files that they’ve accessed each time they go to SharePoint. Now from time to time, you will need to remove a user from your folders for various reasons, often that you know, somebody in a previous role is leaving and somebody in a new role is starting, so you wanna make sure that you remove the access for the previous person. To do that, you again, hover your cursor over the department, go to the menu, choose manage access, and you will see in this menu over to the side, again, links giving access, and then you will see people who can view and people who can edit. For the user that you want to remove, you simply click this X next to their name it will give you this pop-up asking if you’re really sure. If you are, click Remove and you will now see that that user has vanished, they are gone they no longer have access, they’re no longer listed here. So that is the basics of how to set up a new folder and how to give someone access to the folder and remove access to the folder. These same instructions are covered in written instructions, which are also linked on the Axiom homepage. So you’ll have both this video and the written instructions, but if you have any questions as you’re going through this, of course, please don’t hesitate to reach out to the Budget Office staff, thank you.