

The data of Black History
Phrases like “data visualization” and “data driven insights” are ubiquitous in the modern context, so much so that the history of these techniques is not often well documented. As part of the library’s celebration of Black History Month, we want to highlight the visionary data portraits created by W.E.B. Du Bois for exhibition at the 1900 World’s Fair in Paris, France.
In the aftermath of the civil war, Thomas Calloway and Booker T. Washington advocated for the United States to include an exhibit on African American life, arguing it demonstrated a commitment to social reform and progress (Du Bois, W. E. B, et al. W.E.B. Du Bois’s Data Portraits : Visualizing Black America : The Color Line at the Turn of the Twentieth Century,pp 5). The resulting work was not only innovative and visually stunning- it refuted the racist ideologies of black inferiority and eugenic pseudoscience with clear empirical evidence. The exhibit drew on data collected through fieldwork in Atlanta, The United States Census, and other government data sources compiled by Du Bois and his sociology lab students (ibid 6).
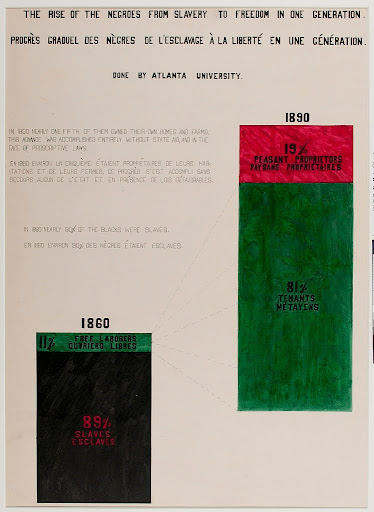
While having to use ‘objective’ empirical measures to prove the worth of human beings is never something to celebrate, the sociological logic and visualization techniques Du Bois and his students employed are still used to this day in quantitative social science research methods. For example, stacked bar charts are a type of visual representation often used to quickly compare data between groups and categories. The stacked bar chart below demonstrates that in the thirty years following the emancipation proclamation, almost twenty percent of black Americans owned their own properties. One of our favorite parts is the note “This advance was accomplished entirely without state aid, and in the face of proscriptive laws”. If you want to learn more about the story of Du Bois and see detailed portraits, check out W.E.B. Du Bois’s data portraits : visualizing Black America : the color line at the turn of the twentieth century.
References
ICPSR’s Data and Resources Documenting Black History in the United States Guide
Public Domain Review: W.E.B. Dubois Data Visualizations
Three-Generation National Survey of Black American Families, 1979-1981 (ICPSR 9288)
Library of Congress: African American Photographs Assembled for 1900 Paris Exposition
Media Contact
Written by Julia Deen (Data Librarian)