

Special Collections sees record number of students this academic year
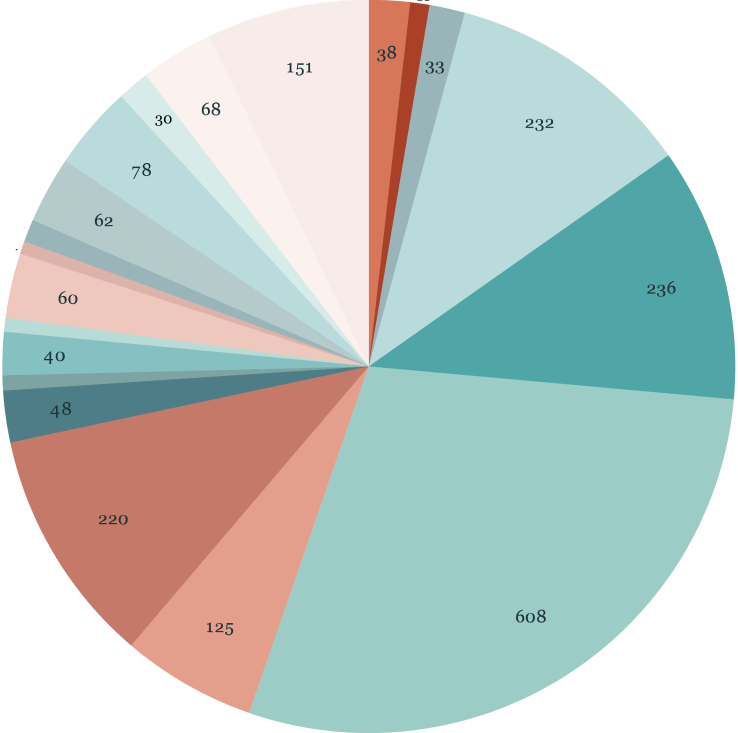
With just three weeks remaining in the Spring semester, we’re looking back at a robust schedule of class visits from 18 academic departments, plus the Bread Loaf School of English and Language Schools.
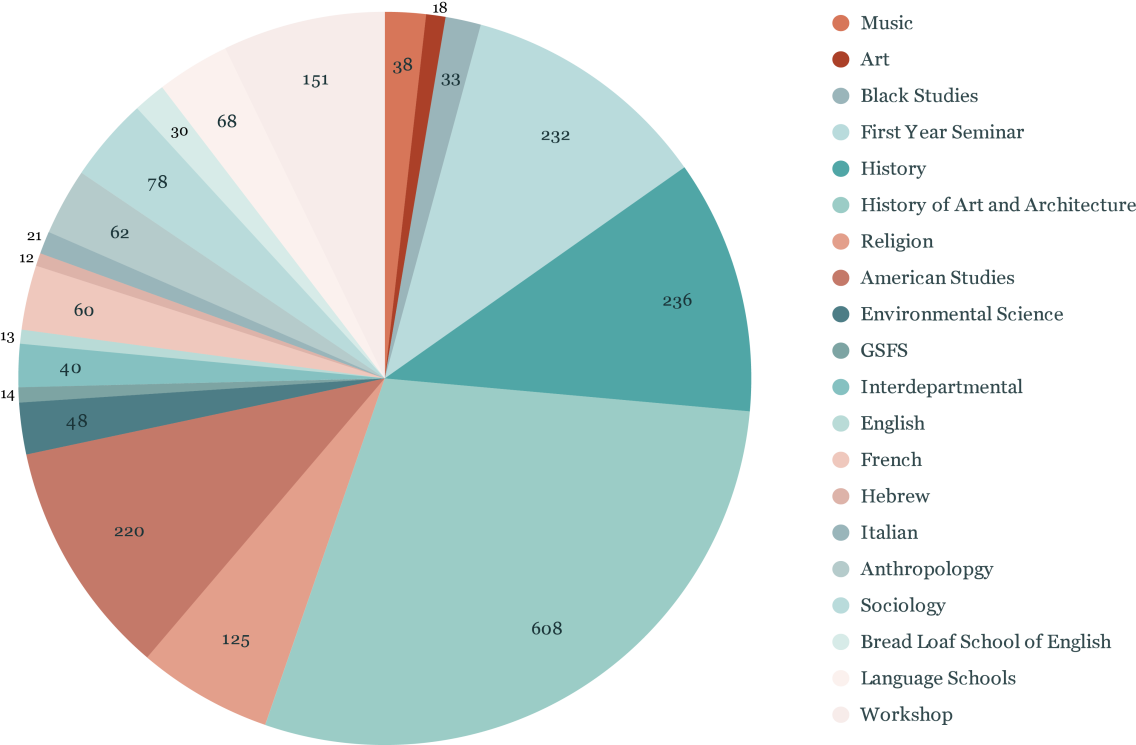
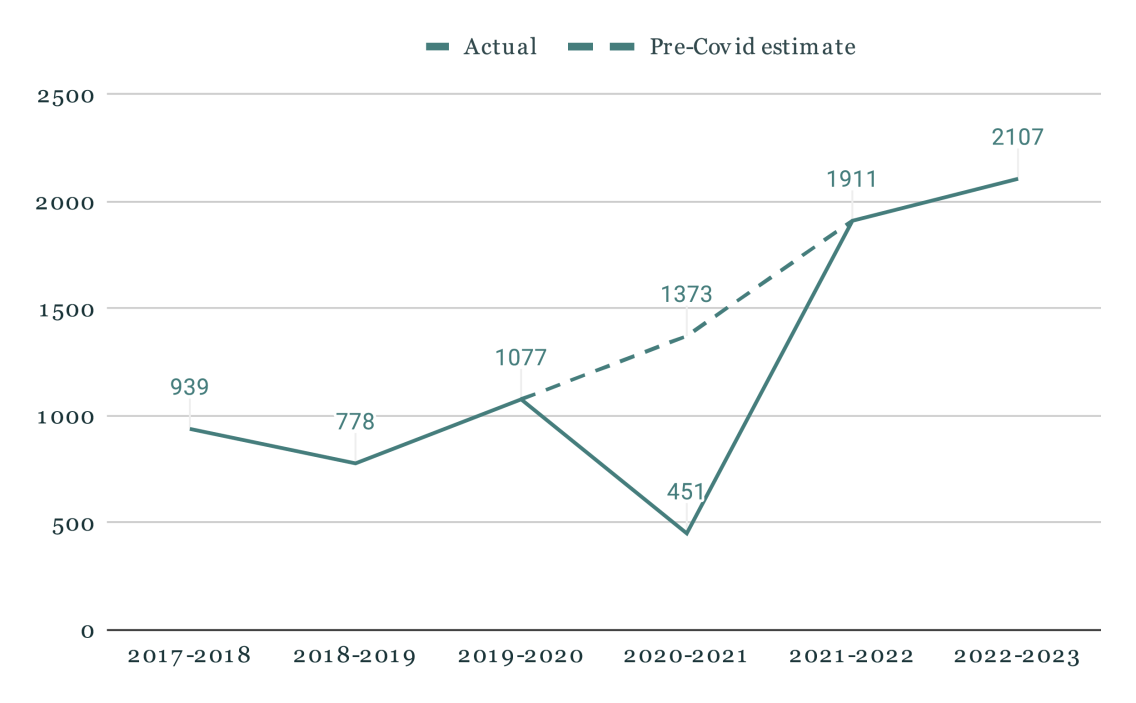
History of Art and Architecture took the lead with most visits, and we’re especially proud to have reached 30% of first year students in their First Year Seminar courses. After a pandemic dip, we saw a 323.73% increase in numbers last year with this year representing a 96% increase compared to pre-pandemic numbers.
And these numbers only represent students who visit with classes! We also welcomed hundreds more researchers from within and beyond the College. You can schedule a visit (go/specialvisit/) or walk in whenever we’re open.