Data Science Across Disciplines Class of 2024

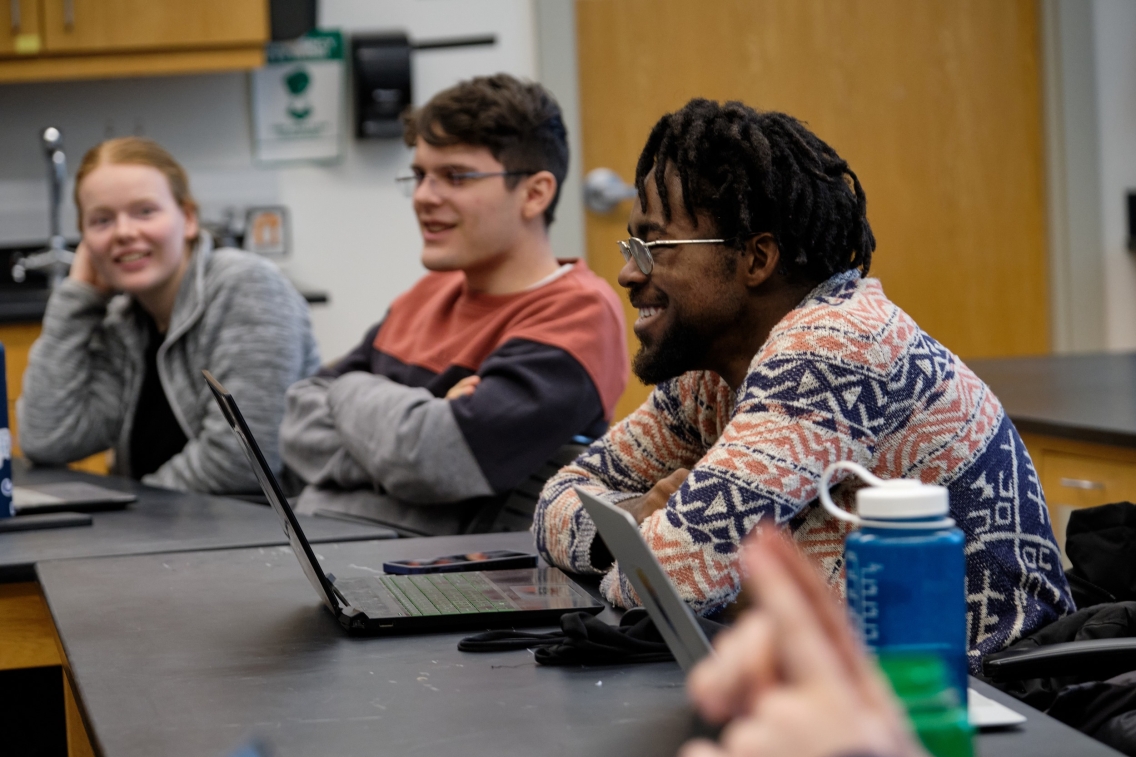
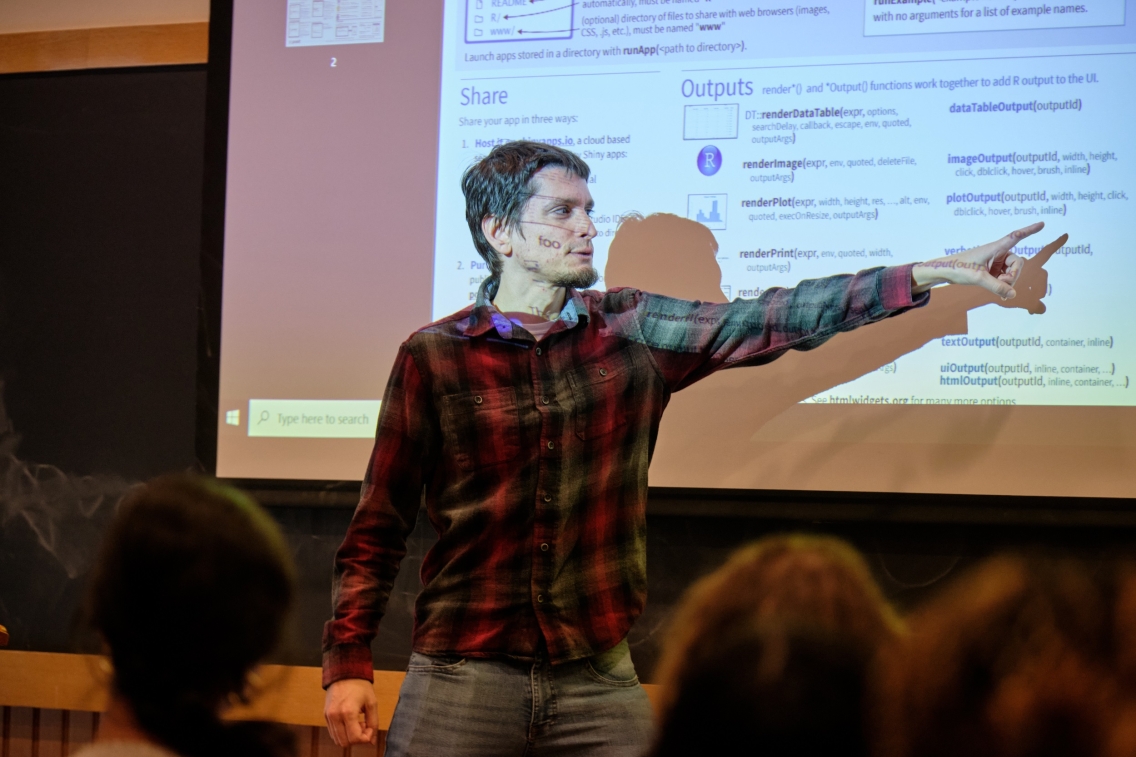
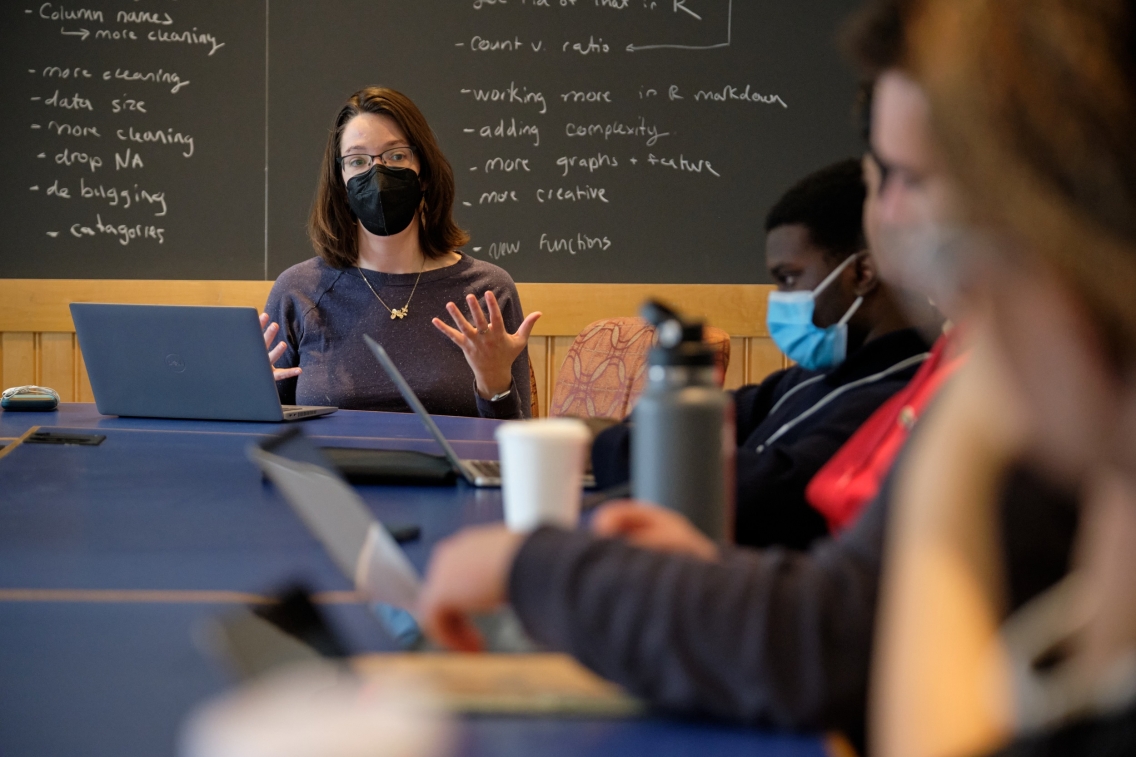
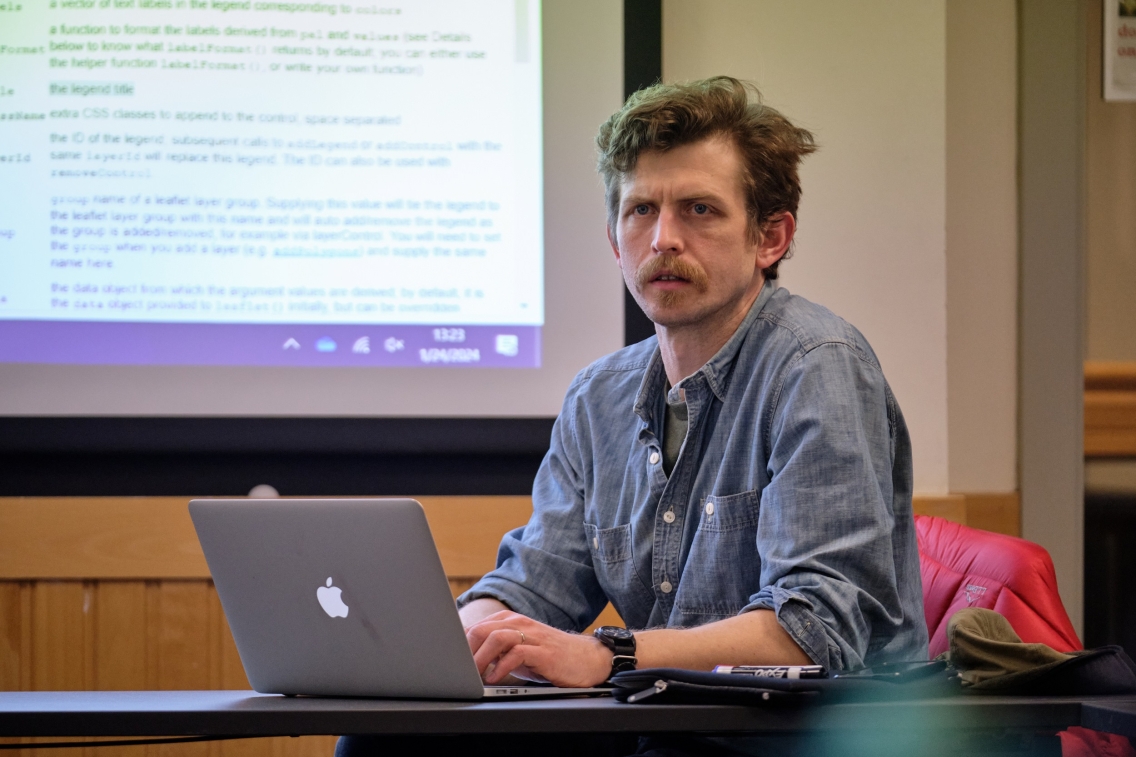
This J-term, midd.data mounted our fourth iteration of Data Science Across Disciplines, and it was another big success! Six instructors—Alex Lyford (Mathematics and Statistics), Bert Johnson (Political Science), Pete Nelson (Geography), Katherine O’Brien (Center for Community Engagement), Conor Stinson (‘06.5) and Michael Czekanski (‘20)—worked with fifty students spanning fourteen different declared majors to solve a range of challenging, data-driven problems, while learning the necessary data science and computational tools along the way!
In the morning sessions, students were introduced to data science as they learned to graph, map, animate, and wrangle data using the programming language R. In the afternoon, students broke out into one of five separate sections to apply their new skills to a research project. Depending on the section into which they enrolled, students worked on one of five projects, which you can read about below.
Evaluating the efficacy of a DUI diversion program
In the first of these projects, Katherine O’Brien partnered with Jean Stone, Executive Director at Addison County Restorative Justice (ACRJ), to investigate the efficacy of their first-time offender DUI diversion program, as well as other restorative justice, court diversion, and pretrial service programs offered by ACRJ. Restorative justice focuses on the personal and interpersonal dimensions of crime with an emphasis on the needs of the victims. Throughout the course, students learned about the types of crimes committed in Addison county, which participants engaged with each of ACRJ’s restorative justice programs, and how effective these programs were for community members of different demographics, including age, race, and sex.
Studying the themes of Vermont selectboard meetings
If you’ve ever been interested in knowing about what goes on at selectboard meetings across Vermont, look no further! Students interested in local Vermont government worked with Conor Stinson to create a database of all of the publicly-available minutes from each selectboard meeting from each of the 251 towns across Vermont. Students learned about the demographics of each Vermont town using Census data, and investigated which towns were in compliance with the Vermont Open Meeting Law. Using an Optical Character Recognition algorithm and the R shiny package, students combined hand-written minutes with more standardized typed minutes to create a searchable database of all town meeting minutes. This online application makes it easy to figure out what a particular town is discussing at their selectboard meetings or to find all mentions of the word “flood” across all towns, with a colored map highlighting the towns where “floods” are discussed the most. The public-facing database will be available soon, so stay tuned!
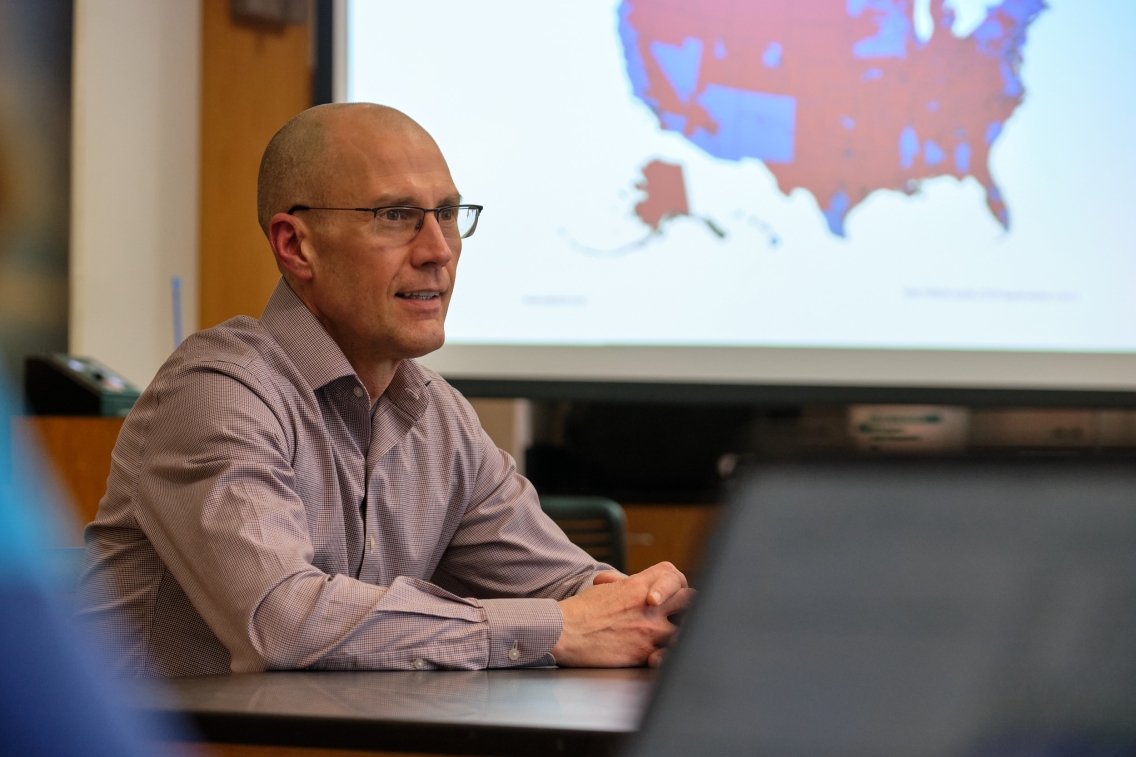
Extracting signal from the noise of U.S. campaign contributions
Students worked with Bert Johnson to creatively illuminate the often-misunderstood world of congressional campaign funding. Most of the money in U.S. national politics is collected and spent by candidates for federal office, and the vast majority of this money is reported publicly to the Federal Election Commission and details are posted on the web. The data that Bert and students compiled contained millions of individual campaign contributions, making it challenging for the average person to parse and interpret. Students made an array of dynamic, colorful, and interactive applications that creatively illuminate congressional campaign funding. Some of the applications highlighted the large differences between in-district and out-of-district contributions across each congressional district, while another app focused on changes in campaign donations before and after an endorsement by a major political figure, such as Donald Trump or Bernie Sanders.
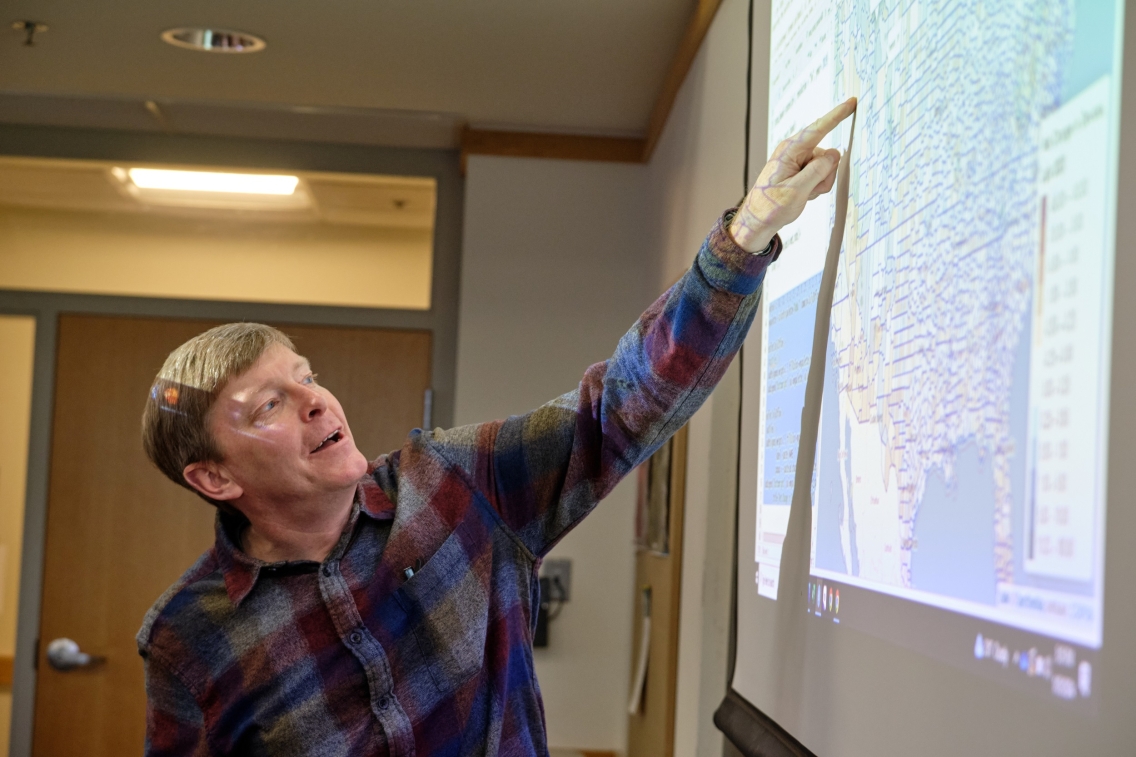
Using cell-phone location data to track migration
Through a major grant obtained by Pete Nelson, he and his students had access to individual-level cell-phone tracking data, which identified the “home” location of each phone. Using these “home” designations, students started by looking at aggregated flow data to identify the types of counties in the US with large monthly in/out flows of devices. They then aggregated these flows based on established classifications used by agencies like USDA, CDC, and the Census Bureau, and their analysis revealed that Recreation-Based Counties (as defined by USDA) saw the biggest shifts in their migration profiles comparing pre-pandemic rhythms with those during 2020 and 2021. Students then built on that analysis by classifying counties based on other socioeconomic indicators pulled from the Census Bureau. Classifications included distinctions based on racial composition and cost of housing to see how migration flows varied across these types of places. Among many other interesting findings, students found that the NYC-VT migration flows showed a distinct spike in April and May of 2020, as reported anecdotally in the popular press.
Investigating the causes of life-threatening neonatal illness
Michael Czekanski and his students partnered with Tom Hays, Neonatologist and Assistant Professor of Pediatrics at Columbia University Irving Medical Center to investigate causes of Necrotizing Enterocolitis (NEC), a life-threatening inflammation of the intestines affecting approximately 5% of all premature infants. The mortality rate for NEC is close to 50%, and little is known about its root causes. Students worked with a novel dataset of 100,000 Neonatal Intensive Care Unit infants to identify relationships between sex, gestational age, genetic disorders, infant feeding types, and NEC prevalence. Among their findings, students identified that there was no evidence that any of the observed genetic disorders (such as Trisomy 21 and cystic fibrosis) made infants more likely to develop NEC at any stage.
All in all, it was a fantastic J-term! In our post-semester survey, 96% of students reported that they learned a lot in class, 93% of students agreed that they could see clear ways that they could apply their new data science skills to other classes at Middlebury, and 90% of students agreed that Middlebury should offer more classes like Data Science Across Disciplines. If you’re a faculty, staff, or alum with a data-driven research question who might be interested in team-teaching this course in a future J-term semester and learning some data science along with the students, let us know!