

Courses and Workshops
Midd.data supports innovative courses that provide a hands-on introduction to data and digital methods while illuminating pathways to continue to learn and apply these tools across the curriculum.
Introduction to Data
In 2022 midd.data launched a credit-bearing “Introduction to Data” summer course for incoming first-year students.
Designed and taught by Tanya Byker from Middlebury’s economics department, the course begins with three weeks of remote instruction via synchronous Zoom sessions, with students working together and with the professor and a teaching assistant to complete short assignments. These remote sessions focused on data acquisition and management, the basics of Excel and R, and the use (and misuse) of data in public discourse. Students then arrive early on Middlebury’s campus for an in-person intensive session focused on further developing data analysis skills through in-depth project-based learning requiring the use of R. The course culminates with student presentations of empirical research projects tied to the theme “Data for Justice.”
In addition, during the intensive in-person portion of the class, students have the opportunity to meet and hear from faculty across the curriculum, who offer insights and opportunities for the students to continue their exploration of data science at Middlebury.
We are able to provide 18 incoming first-year students with financial support to enroll in the course at no cost. Students are selected and invited to apply by Middlebury’s Admissions department.
Courses offered in the past four years. Courses offered currently are as noted.
SUMR 1008
Introduction to Data
Course Description
Introduction to Data
Data analysis is a tool used by astrophysicists and advertisers, politicians and students of Shakespeare. Data can be used to manipulate and harm; and it can be used to address the most pressing issues facing society from curing disease to fighting injustice. This course is an introduction to data for students with any background, planning to pursue any major at Middlebury. We will tackle the following questions: How is data collected? How do we access data? How do we use data? We will get data into a format we can analyze, learn theoretical and practical tools for analysis, and explore ways to communicate our findings (e.g., data visualization). (The course will have a topical theme that may change from year to year.) (Only open to incoming first year students)
Terms Taught
Requirements
Midd.data Director Alex Lyford and students sit down to talk about Intro to Data Science summer course
Data Science Across Disciplines
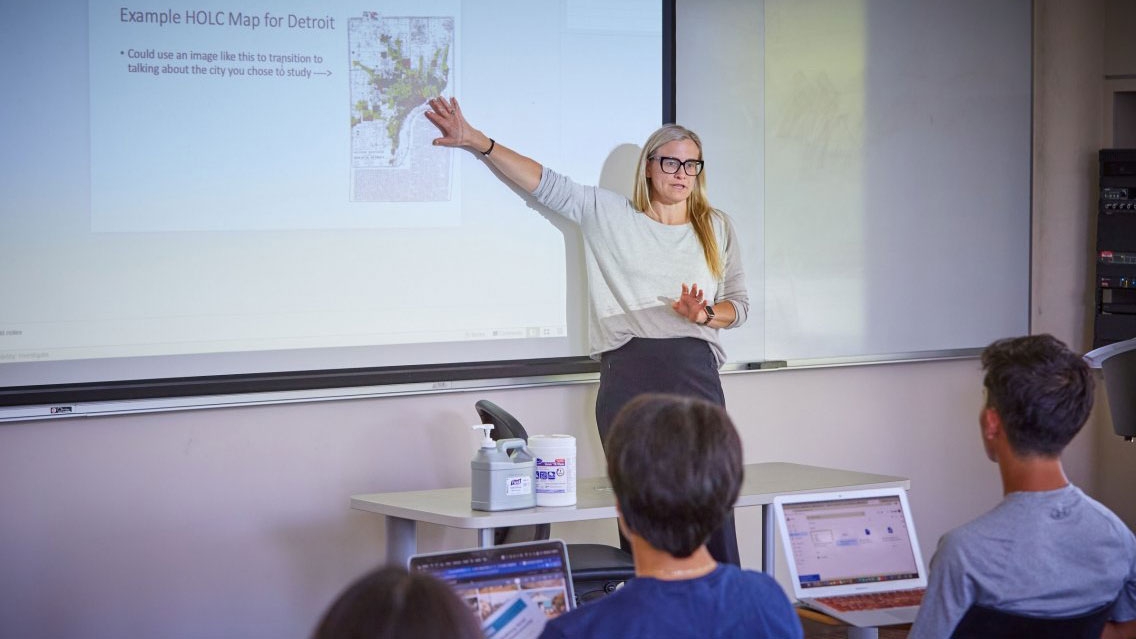
Each January Term, a rotating and interdisciplinary group of Middlebury faculty team up to teach “Data Science Across Disciplines.” This course blends a traditional introduction to data science with immersive project-based applications across disciplines on topics ranging from seventeenth-century Dutch art to tick-borne disease to Japanese pop culture to abortion policy.
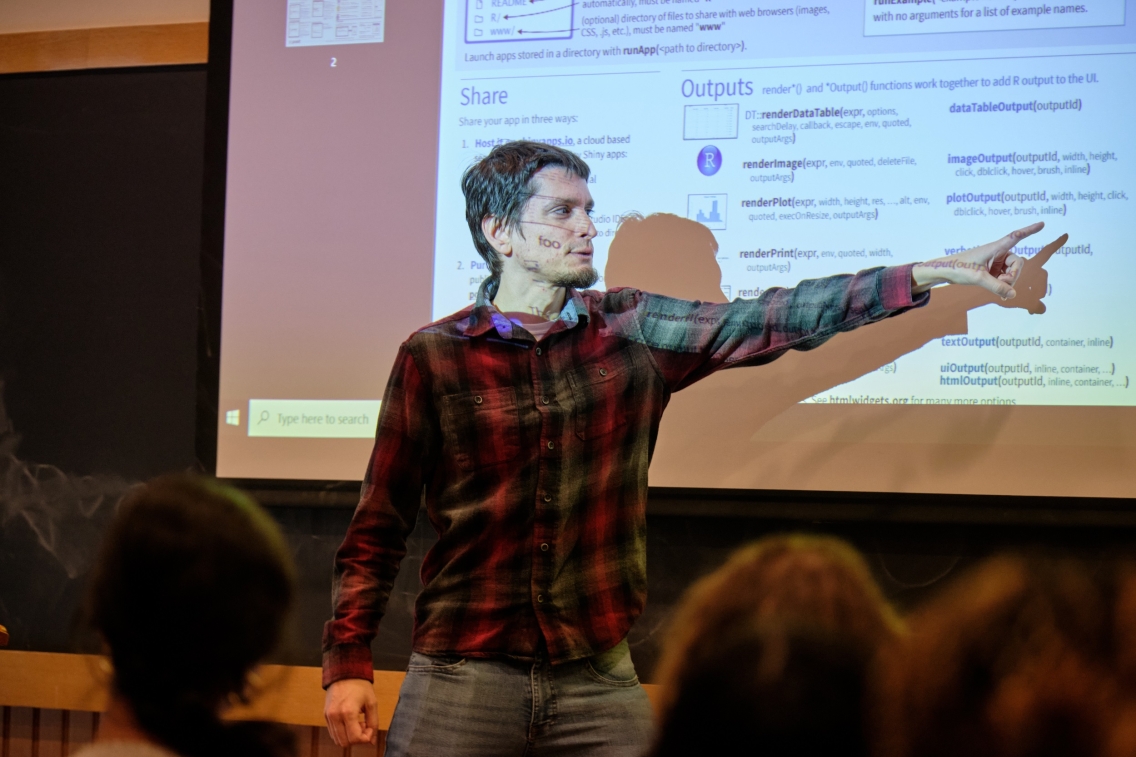
In the morning, all enrolled students across the four sister sections attend a common lecture covering the general tools and practices of data science and digital methods. The topics include data acquisition and management, text analysis, visualization, mapping, web scraping, and interactive web applications, all taught in the R software environment. Following the morning lectures, students break out into one of four afternoon sections that provides students the opportunity to apply the tools they were learning to discipline-specific inquiry.
These project-based learning opportunities afforded students the opportunity to practice and apply their skills by pursuing their curiosity on an academic research project. Students are able to obtain and wrangle real-world messy data in all their complex glory; experience, recognize, and appreciate the ambiguities and art of data analysis; critically engage the decisions we make as data scientists and digital scholars; and practice communication with broad audiences.
In only 4 short weeks students, most of whom had no prior experience in data science or coding, acquire the fundamental skills needed to code and build interactive web applications.
Each year this course is taught by a different group of faculty and is listed under the departments and programs of the faculty members. All of the sister sections have a common number: 1230. Check the course catalog and midd.data’s news page for information on upcoming lineups.
Most sections of Data Science Across Disciplines count towards major credit in their listed departments and programs; check with the associated instructor to verify whether a specific course is eligible for major credit. Students who have taken MATH/STAT 118 or MATH/STAT 201 are not eligible to enroll in Data Science Across Disciplines.
Courses offered in the past four years. Courses offered currently are as noted.
BIOL 1230
DataScience Across Disciplines
Course Description
Data Science Across Disciplines
In this course, we will gain exposure to the entire data science pipeline—obtaining and cleaning large and messy data sets, exploring these data and creating engaging visualizations, and communicating insights from the data in a meaningful manner. During morning sessions, we will learn the tools and techniques required to explore new and exciting data sets. During afternoon sessions, students will work in small groups with one of several faculty members on domain-specific research projects in Anthropology, Biology, Classics, Political Science, and Statistics. This course will use the R programming language. No prior experience with programming is necessary. (Not open to students who have taken STAT 0118, STAT 0201, ANTH 1230, BIOL 1230, CLAS 1230, ECON 1230, ECSC 1230, ENVS 1230, FMMC 1230, GEOG 1230, HARC 1230, HIST 1230, JAPN 1230, LNGT 1230, MATH 1230, NSCI 1230, PSCI 1230, SOCI 1230, STAT 1230, or WRPR 1230.)
ANTH/LNGT: In this section we will explore indigenous political voice in unexpected places. The data we will analyze will consist of bilingual Apache-English and Maidu-English stories, songs and speeches originally recorded by anthropological linguists in the early twentieth century as examples of traditional culture. Students will use R to search this corpora for how indigenous contributors were also making claims on the future in their address to the researcher and to wider anticipated audiences.
BIOL/ECSC 1230: In this section we will work with data collected by elephant seals equipped with oceanographic instruments in the Southern Ocean. Depending on your interests, you can approach the project from different angles: students focusing on biology will explore where the seals travel and what drives their movements, while those interested in earth science will investigate the temperature and salinity profiles gathered during their dives. Working in teams, you’ll combine these perspectives to build a fuller picture of both seal ecology and the oceanographic processes that shape their environment. Along the way, you’ll practice manipulating and visualizing different types of data including maps of seal tracks, temperature and salinity profiles, and cross-sections of ocean properties. We will also bring in satellite and autonomous float data to place seal activity and the data they collect in a broader context. By the end, you’ll have a sense of how these different data sources fit together and what unique insights we gain from using seals as oceanographers.
CLAS 1230: In this section students will gain hands-on experience with a variety of natural language processing and text mining techniques by exploring the writings of the ancient historian Plutarch, who lived during the first and second centuries AD. We will focus on the biographies of "great men" in Plutarch’s Lives, which chronicles the history, morals, and virtues of major figures who played parallel roles in ancient Greek and Roman society. The public domain English translation from Project Gutenberg will serve as our main corpus; however, students with a background or interest in Ancient Greek can work with the text in the original language. Using the R programming language, students will transform unstructured text into quantitative data for statistical analysis and morphosyntactic parsing. We will also apply machine learning models to our data to reveal underlying patterns in large amounts of text. No prior experience with R is necessary.
PSCI 1230: Who votes in elections? Who attends protests? Why? In this section we will use the tools of data science to explore these and other questions about political participation in the Americas. We will examine engagement in different forms of participation and the demographic, economic, social, and other factors that shape participation. The class will introduce students to the basics of survey research and the study of political participation. Students will complete a final group project showcasing the concepts and tools learned in class.
STAT 1230: In this section students will dive into the world of data science by focusing on invasive species monitoring data. Early detection is crucial to controlling many invasive species; however, there is a knowledge gap regarding the sampling effort needed to detect the invader early. In this course, we will work with decades of invasive species monitoring data collected across the United States to better understand how environmental variables play a role in the sampling effort required to detect invasive species. Students will gain experience in the entire data science pipeline, but the primary focus will be on data scraping, data visualization, and communication of data-based results to scientists and policymakers.
Terms Taught
Requirements
GEOG 1230
DataScience Across Disciplines
Course Description
Data Science Across Disciplines
In this course, we will gain exposure to the entire data science pipeline—obtaining and cleaning, large and messy data sets, exploring these data and creating engaging visualizations, and communicating insights from the data in a meaningful manner. During morning sessions, we will learn the tools and techniques required to explore new and exciting data sets. During afternoon sessions, students will work in small groups with one of several faculty members on domain-specific research projects in Biology, Geography, History, Mathematics/Statistics and Sociology. This course will use the R programming language. No prior experience with R is necessary.
BIOL 1230: Students enrolled in Professor Casey’s (Biology) afternoon section will use the tools of data science to investigate the drivers of tick abundance and tick-borne disease risk. To do this students will draw from a nation-wide ecological database.
GEOG 1230: In this section, we will investigate human vulnerability to natural hazards in the United States using location-based text data about hurricane and flood disasters from social media. We will analyze data qualitatively, temporally, and spatially to gain insights into the human experience of previous disasters and disaster response. We will present findings using spatial data visualizations with the aim of informing future disaster preparedness and resilience.
HIST 1230: In U.S. history, racial differences and discrimination have powerfully shaped who benefited from land and farm ownership. How can historians use data to understand the history of race and farming? Students will wrangle county- and state-level data from the U.S. Census of Agriculture from 1840-1912 to create visualizations and apps that allow us to find patterns in the history of race and land, to discover new questions we might not know to ask, and to create tools to better reveal connections between race, land, and farming for a general audience.
STAT 1230: In this course students will dive into the world of data science by focusing on invasive species monitoring data. Early detection is crucial to controlling many invasive species; however, there is a knowledge gap regarding the sampling effort needed to detect the invader early. In this course, we will work with decades of invasive species monitoring data collected across the United States to better understand how environmental variables play a role in the sampling effort required to detect invasive species. Students will gain experience in the entire data science pipeline, but the primary focus will be on data scraping, data visualization, and communication of data-based results to scientists and policymakers.
SOCI 1230: Do sports fans care about climate change? Can sports communication be used to engage audiences on environmental sustainability? In this section of the course, students will use the tools of data science to examine whether interest in sports is associated with climate change knowledge, attitudes and behaviors, as well as other political opinions. Participants will use survey data to produce visualizations and exploratory analyses about the relationship between sports fandom and attitudes about environmental sustainability.
Terms Taught
Requirements
HIST 1230
DataScience Across Disciplines
Course Description
Data Science Across Disciplines
In this course, we will gain exposure to the entire data science pipeline—obtaining and cleaning, large and messy data sets, exploring these data and creating engaging visualizations, and communicating insights from the data in a meaningful manner. During morning sessions, we will learn the tools and techniques required to explore new and exciting data sets. During afternoon sessions, students will work in small groups with one of several faculty members on domain-specific research projects in Biology, Geography, History, Mathematics/Statistics and Sociology. This course will use the R programming language. No prior experience with R is necessary.
BIOL 1230: Students enrolled in Professor Casey’s (Biology) afternoon section will use the tools of data science to investigate the drivers of tick abundance and tick-borne disease risk. To do this students will draw from a nation-wide ecological database.
GEOG 1230: In this section, we will investigate human vulnerability to natural hazards in the United States using location-based text data about hurricane and flood disasters from social media. We will analyze data qualitatively, temporally, and spatially to gain insights into the human experience of previous disasters and disaster response. We will present findings using spatial data visualizations with the aim of informing future disaster preparedness and resilience.
HIST 1230: In U.S. history, racial differences and discrimination have powerfully shaped who benefited from land and farm ownership. How can historians use data to understand the history of race and farming? Students will wrangle county- and state-level data from the U.S. Census of Agriculture from 1840-1912 to create visualizations and apps that allow us to find patterns in the history of race and land, to discover new questions we might not know to ask, and to create tools to better reveal connections between race, land, and farming for a general audience.
STAT 1230: In this course students will dive into the world of data science by focusing on invasive species monitoring data. Early detection is crucial to controlling many invasive species; however, there is a knowledge gap regarding the sampling effort needed to detect the invader early. In this course, we will work with decades of invasive species monitoring data collected across the United States to better understand how environmental variables play a role in the sampling effort required to detect invasive species. Students will gain experience in the entire data science pipeline, but the primary focus will be on data scraping, data visualization, and communication of data-based results to scientists and policymakers.
SOCI 1230: Do sports fans care about climate change? Can sports communication be used to engage audiences on environmental sustainability? In this section of the course, students will use the tools of data science to examine whether interest in sports is associated with climate change knowledge, attitudes and behaviors, as well as other political opinions. Participants will use survey data to produce visualizations and exploratory analyses about the relationship between sports fandom and attitudes about environmental sustainability.
Terms Taught
Requirements
INTD 1230
DataScience Across Disciplines
Course Description
Data Science Across Disciplines
In this course, we will gain exposure to the entire data science pipeline—obtaining and cleaning large and messy data sets, exploring these data and creating engaging visualizations, and communicating insights from the data in a meaningful manner. During morning sessions, we will learn the tools and techniques required to explore new and exciting data sets. During afternoon sessions, students will work in small groups with one of several faculty members on domain-specific research projects in Geography, Political Science, Restorative Justice, or Healthcare. This course will use the R programming language. No prior experience with R is necessary.
INTD 1230 A: Data is a powerful tool for improving health outcomes by making programmatic choices to support justice. In this afternoon section of Data Across the Disciplines, students will be working with Addison County Restorative Justice (ACRJ) on understanding patterns in the occurrence of driving under the influence. ACRJ has over 1,000 cases and would like to better understand their data and come up with ways to access information. We will explore how identity, geography, and support impact outcomes from DUI cases. Using statistical analysis and data visualizations, along with learning about ethical data practices, we will report our findings.
INTD 1230 B: Let’s dive into the minutes and reports of local towns to develop an accessible news and history resource. Could this be a tool for small newspapers to track local news more easily? Can we map this fresh data for a new look across geographies? Do you want to help volunteer town officials make decisions and better wrangle with their town’s history and data? In this course we will develop a focused database of documents produced by several municipal boards and commissions. We will engage in conversation with local officials, researchers, and journalists. This course aims to introduce students to making data from real world documents and the people that make them to generate useful information that is often open but frequently difficult to sift through.
GEOG 1230: In this section, students will use data science tools to explore the ways migration systems in the United States changed during the COVID-19 pandemic. We will draw on data collected from mobile phones recording each phone’s monthly place of residence at the census tract level. The dataset includes monthly observations from January 2019 through December 2021 allowing the analysis to compare migration systems pre-pandemic with those during the pandemic.
MATH/STAT 1230: Students will explore pediatric healthcare data to better understand the risks correlated with various childhood illnesses through an emphasis on the intuition behind statistical and machine learning techniques. We will practice making informed decisions from noisy data and the steps to go from messy data to a final report. Students will become proficient in R and gain an understanding of various statistical techniques.
PSCI 1230: How do candidates for U.S. national office raise money? From whom do they raise it? In this section we will explore these questions using Federal Election Commission data on individual campaign contributions to federal candidates. Our analysis using R will help us identify geographic patterns in the data, as well as variations in funds raised across types of candidates. We will discuss what implications these patterns may have for the health and functioning of democracy in the U.S.
Terms Taught
Requirements
LNGT 1230
DataScience Across Disciplines
Course Description
Data Science Across Disciplines
In this course, we will gain exposure to the entire data science pipeline—obtaining and cleaning large and messy data sets, exploring these data and creating engaging visualizations, and communicating insights from the data in a meaningful manner. During morning sessions, we will learn the tools and techniques required to explore new and exciting data sets. During afternoon sessions, students will work in small groups with one of several faculty members on domain-specific research projects in Anthropology, Biology, Classics, Political Science, and Statistics. This course will use the R programming language. No prior experience with programming is necessary. (Not open to students who have taken STAT 0118, STAT 0201, ANTH 1230, BIOL 1230, CLAS 1230, ECON 1230, ECSC 1230, ENVS 1230, FMMC 1230, GEOG 1230, HARC 1230, HIST 1230, JAPN 1230, LNGT 1230, MATH 1230, NSCI 1230, PSCI 1230, SOCI 1230, STAT 1230, or WRPR 1230.)
ANTH/LNGT 1230: In this section we will explore indigenous political voice in unexpected places. The data we will analyze will consist of bilingual Apache-English and Maidu-English stories, songs and speeches originally recorded by anthropological linguists in the early twentieth century as examples of traditional culture. Students will use R to search this corpora for how indigenous contributors were also making claims on the future in their address to the researcher and to wider anticipated audiences. This course includes a community engagement component.
BIOL/ECSC 1230: In this section we will work with data collected by elephant seals equipped with oceanographic instruments in the Southern Ocean. Depending on your interests, you can approach the project from different angles: students focusing on biology will explore where the seals travel and what drives their movements, while those interested in earth science will investigate the temperature and salinity profiles gathered during their dives. Working in teams, you’ll combine these perspectives to build a fuller picture of both seal ecology and the oceanographic processes that shape their environment. Along the way, you’ll practice manipulating and visualizing different types of data including maps of seal tracks, temperature and salinity profiles, and cross-sections of ocean properties. We will also bring in satellite and autonomous float data to place seal activity and the data they collect in a broader context. By the end, you’ll have a sense of how these different data sources fit together and what unique insights we gain from using seals as oceanographers.
CLAS 1230: In this section students will gain hands-on experience with a variety of natural language processing and text mining techniques by exploring the writings of the ancient historian Plutarch, who lived during the first and second centuries AD. We will focus on the biographies of "great men" in Plutarch’s Lives, which chronicles the history, morals, and virtues of major figures who played parallel roles in ancient Greek and Roman society. The public domain English translation from Project Gutenberg will serve as our main corpus; however, students with a background or interest in Ancient Greek can work with the text in the original language. Using the R programming language, students will transform unstructured text into quantitative data for statistical analysis and morphosyntactic parsing. We will also apply machine learning models to our data to reveal underlying patterns in large amounts of text. No prior experience with R is necessary.
PSCI 1230: Who votes in elections? Who attends protests? Why? In this section we will use the tools of data science to explore these and other questions about political participation in the Americas. We will examine engagement in different forms of participation and the demographic, economic, social, and other factors that shape participation. The class will introduce students to the basics of survey research and the study of political participation. Students will complete a final group project showcasing the concepts and tools learned in class.
STAT 1230: In this section students will dive into the world of data science by focusing on invasive species monitoring data. Early detection is crucial to controlling many invasive species; however, there is a knowledge gap regarding the sampling effort needed to detect the invader early. In this course, we will work with decades of invasive species monitoring data collected across the United States to better understand how environmental variables play a role in the sampling effort required to detect invasive species. Students will gain experience in the entire data science pipeline, but the primary focus will be on data scraping, data visualization, and communication of data-based results to scientists and policymakers.
Terms Taught
Requirements
MATH 1230
DataScience Across Disciplines
Course Description
Data Science Across Disciplines
In this course, we will gain exposure to the entire data science pipeline—obtaining and cleaning large and messy data sets, exploring these data and creating engaging visualizations, and communicating insights from the data in a meaningful manner. During morning sessions, we will learn the tools and techniques required to explore new and exciting data sets. During afternoon sessions, students will work in small groups with one of several faculty members on domain-specific research projects in Biology, Geography, History, Mathematics/Statistics and Sociology. This course will use the R programming language. No prior experience with R is necessary.
BIOL 1230: Students enrolled in Professor Casey’s afternoon section will use the tools of data science to investigate the drivers of tick abundance and tick-borne disease risk. To do this students will draw from a nation-wide ecological database.
GEOG 1230: In this section, we will investigate human vulnerability to natural hazards in the United States using location-based text data about hurricane and flood disasters from social media. We will analyze data qualitatively, temporally, and spatially to gain insights into the human experience of previous disasters and disaster response. We will present findings using spatial data visualizations with the aim of informing future disaster preparedness and resilience.
HIST 1230: In U.S. history, racial differences and discrimination have powerfully shaped who benefited from land and farm ownership. How can historians use data to understand the history of race and farming? Students will wrangle county- and state-level data from the U.S. Census of Agriculture from 1840-1912 to create visualizations and apps that allow us to find patterns in the history of race and land, to discover new questions we might not know to ask, and to create tools to better reveal connections between race, land, and farming for a general audience.
MATH/STAT 1230: Students will explore pediatric healthcare data to better understand the risks correlated with various childhood illnesses through an emphasis on the intuition behind statistical and machine learning techniques. We will practice making informed decisions from noisy data and the steps to go from messy data to a final report. Students will become proficient in R and gain an understanding of various statistical techniques.
SOCI 1230: Do sports fans care about climate change? Can sports communication be used to engage audiences on environmental sustainability? In this section of the course, students will use the tools of data science to examine whether interest in sports is associated with climate change knowledge, attitudes and behaviors, as well as other political opinions. Participants will use survey data to produce visualizations and exploratory analyses about the relationship between sports fandom and attitudes about environmental sustainability.
Terms Taught
Requirements
PSCI 1230
DataScience Across Disciplines
Course Description
Data Science Across Disciplines
In this course, we will gain exposure to the entire data science pipeline—obtaining and cleaning large and messy data sets, exploring these data and creating engaging visualizations, and communicating insights from the data in a meaningful manner. During morning sessions, we will learn the tools and techniques required to explore new and exciting data sets. During afternoon sessions, students will work in small groups with one of several faculty members on domain-specific research projects in Anthropology, Biology, Classics, Political Science, and Statistics. This course will use the R programming language. No prior experience with programming is necessary. (Not open to students who have taken STAT 0118, STAT 0201, ANTH 1230, BIOL 1230, CLAS 1230, ECON 1230, ECSC 1230, ENVS 1230, FMMC 1230, GEOG 1230, HARC 1230, HIST 1230, JAPN 1230, LNGT 1230, MATH 1230, NSCI 1230, PSCI 1230, SOCI 1230, STAT 1230, or WRPR 1230.)
ANTH/LNGT 1230: In this section we will explore indigenous political voice in unexpected places. The data we will analyze will consist of bilingual Apache-English and Maidu-English stories, songs and speeches originally recorded by anthropological linguists in the early twentieth century as examples of traditional culture. Students will use R to search this corpora for how indigenous contributors were also making claims on the future in their address to the researcher and to wider anticipated audiences.
BIOL/ECSC 1230: In this section we will work with data collected by elephant seals equipped with oceanographic instruments in the Southern Ocean. Depending on your interests, you can approach the project from different angles: students focusing on biology will explore where the seals travel and what drives their movements, while those interested in earth science will investigate the temperature and salinity profiles gathered during their dives. Working in teams, you’ll combine these perspectives to build a fuller picture of both seal ecology and the oceanographic processes that shape their environment. Along the way, you’ll practice manipulating and visualizing different types of data including maps of seal tracks, temperature and salinity profiles, and cross-sections of ocean properties. We will also bring in satellite and autonomous float data to place seal activity and the data they collect in a broader context. By the end, you’ll have a sense of how these different data sources fit together and what unique insights we gain from using seals as oceanographers.
CLAS 1230: In this section students will gain hands-on experience with a variety of natural language processing and text mining techniques by exploring the writings of the ancient historian Plutarch, who lived during the first and second centuries AD. We will focus on the biographies of "great men" in Plutarch’s Lives, which chronicles the history, morals, and virtues of major figures who played parallel roles in ancient Greek and Roman society. The public domain English translation from Project Gutenberg will serve as our main corpus; however, students with a background or interest in Ancient Greek can work with the text in the original language. Using the R programming language, students will transform unstructured text into quantitative data for statistical analysis and morphosyntactic parsing. We will also apply machine learning models to our data to reveal underlying patterns in large amounts of text. No prior experience with R is necessary.
PSCI 1230: Who votes in elections? Who attends protests? Why? In this section we will use the tools of data science to explore these and other questions about political participation in the Americas. We will examine engagement in different forms of participation and the demographic, economic, social, and other factors that shape participation. The class will introduce students to the basics of survey research and the study of political participation. Students will complete a final group project showcasing the concepts and tools learned in class.
STAT 1230: In this section students will dive into the world of data science by focusing on invasive species monitoring data. Early detection is crucial to controlling many invasive species; however, there is a knowledge gap regarding the sampling effort needed to detect the invader early. In this course, we will work with decades of invasive species monitoring data collected across the United States to better understand how environmental variables play a role in the sampling effort required to detect invasive species. Students will gain experience in the entire data science pipeline, but the primary focus will be on data scraping, data visualization, and communication of data-based results to scientists and policymakers.
Terms Taught
Requirements
SOCI 1230
DataScience Across Disciplines
Course Description
Data Science Across Disciplines
In this course, we will gain exposure to the entire data science pipeline—obtaining and cleaning, large and messy data sets, exploring these data and creating engaging visualizations, and communicating insights from the data in a meaningful manner. During morning sessions, we will learn the tools and techniques required to explore new and exciting data sets. During afternoon sessions, students will work in small groups with one of several faculty members on domain-specific research projects in Biology, Geography, History, Mathematics/Statistics and Sociology. This course will use the R programming language. No prior experience with R is necessary.
BIOL 1230: Students enrolled in Professor Casey’s (Biology) afternoon section will use the tools of data science to investigate the drivers of tick abundance and tick-borne disease risk. To do this students will draw from a nation-wide ecological database.
GEOG 1230: In this section, we will investigate human vulnerability to natural hazards in the United States using location-based text data about hurricane and flood disasters from social media. We will analyze data qualitatively, temporally, and spatially to gain insights into the human experience of previous disasters and disaster response. We will present findings using spatial data visualizations with the aim of informing future disaster preparedness and resilience.
HIST 1230: In U.S. history, racial differences and discrimination have powerfully shaped who benefited from land and farm ownership. How can historians use data to understand the history of race and farming? Students will wrangle county- and state-level data from the U.S. Census of Agriculture from 1840-1912 to create visualizations and apps that allow us to find patterns in the history of race and land, to discover new questions we might not know to ask, and to create tools to better reveal connections between race, land, and farming for a general audience.
STAT 1230: In this course students will dive into the world of data science by focusing on invasive species monitoring data. Early detection is crucial to controlling many invasive species; however, there is a knowledge gap regarding the sampling effort needed to detect the invader early. In this course, we will work with decades of invasive species monitoring data collected across the United States to better understand how environmental variables play a role in the sampling effort required to detect invasive species. Students will gain experience in the entire data science pipeline, but the primary focus will be on data scraping, data visualization, and communication of data-based results to scientists and policymakers.
SOCI 1230: Do sports fans care about climate change? Can sports communication be used to engage audiences on environmental sustainability? In this section of the course, students will use the tools of data science to examine whether interest in sports is associated with climate change knowledge, attitudes and behaviors, as well as other political opinions. Participants will use survey data to produce visualizations and exploratory analyses about the relationship between sports fandom and attitudes about environmental sustainability.
Terms Taught
Requirements
STAT 1230
DataScience Across Disciplines
Course Description
Data Science Across Disciplines
In this course, we will gain exposure to the entire data science pipeline—obtaining and cleaning large and messy data sets, exploring these data and creating engaging visualizations, and communicating insights from the data in a meaningful manner. During morning sessions, we will learn the tools and techniques required to explore new and exciting data sets. During afternoon sessions, students will work in small groups with one of several faculty members on domain-specific research projects in Anthropology, Biology, Classics, Political Science, and Statistics. This course will use the R programming language. No prior experience with programming is necessary. (Not open to students who have taken STAT 0118, STAT 0201, ANTH 1230, BIOL 1230, CLAS 1230, ECON 1230, ECSC 1230, ENVS 1230, FMMC 1230, GEOG 1230, HARC 1230, HIST 1230, JAPN 1230, LNGT 1230, MATH 1230, NSCI 1230, PSCI 1230, SOCI 1230, STAT 1230, or WRPR 1230.)
ANTH/LNGT 1230: In this section we will explore indigenous political voice in unexpected places. The data we will analyze will consist of bilingual Apache-English and Maidu-English stories, songs and speeches originally recorded by anthropological linguists in the early twentieth century as examples of traditional culture. Students will use R to search this corpora for how indigenous contributors were also making claims on the future in their address to the researcher and to wider anticipated audiences.
BIOL/ECSC 1230: In this section we will work with data collected by elephant seals equipped with oceanographic instruments in the Southern Ocean. Depending on your interests, you can approach the project from different angles: students focusing on biology will explore where the seals travel and what drives their movements, while those interested in earth science will investigate the temperature and salinity profiles gathered during their dives. Working in teams, you’ll combine these perspectives to build a fuller picture of both seal ecology and the oceanographic processes that shape their environment. Along the way, you’ll practice manipulating and visualizing different types of data including maps of seal tracks, temperature and salinity profiles, and cross-sections of ocean properties. We will also bring in satellite and autonomous float data to place seal activity and the data they collect in a broader context. By the end, you’ll have a sense of how these different data sources fit together and what unique insights we gain from using seals as oceanographers.
CLAS 1230: In this section students will gain hands-on experience with a variety of natural language processing and text mining techniques by exploring the writings of the ancient historian Plutarch, who lived during the first and second centuries AD. We will focus on the biographies of "great men" in Plutarch’s Lives, which chronicles the history, morals, and virtues of major figures who played parallel roles in ancient Greek and Roman society. The public domain English translation from Project Gutenberg will serve as our main corpus; however, students with a background or interest in Ancient Greek can work with the text in the original language. Using the R programming language, students will transform unstructured text into quantitative data for statistical analysis and morphosyntactic parsing. We will also apply machine learning models to our data to reveal underlying patterns in large amounts of text. No prior experience with R is necessary.
PSCI 1230: Who votes in elections? Who attends protests? Why? In this section we will use the tools of data science to explore these and other questions about political participation in the Americas. We will examine engagement in different forms of participation and the demographic, economic, social, and other factors that shape participation. The class will introduce students to the basics of survey research and the study of political participation. Students will complete a final group project showcasing the concepts and tools learned in class.
STAT 1230: In this section students will dive into the world of data science by focusing on invasive species monitoring data. Early detection is crucial to controlling many invasive species; however, there is a knowledge gap regarding the sampling effort needed to detect the invader early. In this course, we will work with decades of invasive species monitoring data collected across the United States to better understand how environmental variables play a role in the sampling effort required to detect invasive species. Students will gain experience in the entire data science pipeline, but the primary focus will be on data scraping, data visualization, and communication of data-based results to scientists and policymakers.
Terms Taught
Requirements
WRPR 1230
DataScience Across Disciplines
Course Description
Data Science Across Disciplines
In this course, we will gain exposure to the entire data science pipeline—obtaining and cleaning large and messy data sets, exploring these data and creating engaging visualizations, and communicating insights from the data in a meaningful manner. During morning sessions, we will learn the tools and techniques required to explore new and exciting data sets. During afternoon sessions, students will work in small groups with one of several faculty members on domain-specific research projects in Geography, Linguistics, Political Science, or Writing & Rhetoric. This course will use the R programming language. No prior experience with R is necessary.
GEOG: Students will apply data science tools to explore the geography human-environment relationships around protected areas. We will use household survey and land cover data from locations across the humid tropics where the Wildlife Conservation Society has been tracking human wellbeing and forest resource use in high-priority conservation landscapes. Projects and visualizations will be presented back to WCS to inform their ongoing monitoring and management in these sites.
LNGT: In this section, we will learn how to collect and analyze Twitter data in R. We will focus on social metrics and geographical locations to examine language variation in online communities across the United States. While the emphasis will be placed on linguistics, the statistical and analytical tools will help you work with other types of Twitter corpora in the future.
PSCI: Students will use cross-national data to explore relationships between conflict events and political, social, and economic factors in each nation. What factors contribute to conflict and violence? Our focus will be to find patterns in the data using the tools in R and discuss what those patterns suggest for addressing rising conflict and resolving ones that have already experienced violence.
WRPR: Students will learn to conduct writing studies research through working with "big data” from a multiyear survey of first-year college students about their academic confidences, attitudes, and perceptions. We will explore how educational access, identity, and language background impacts survey responses. Using statistical analysis and data visualizations, as well as writing, we will report our findings.
Terms Taught
Requirements
Learn More about Data Science Across Disciplines
Check out this video of former instructors discussing their experiences teaching the course.
Data Science Across Disciplines 2026
In this video, instructors and students sat down to chat about the Winter 2026 iteration of DSAD.
If you are curious about a previous example, check out this video of former instructors discussing their experiences teaching the course.
Other Introductory Courses
Students who are interested in learning more about data analysis, statistics, coding, and computer science have many options at Middlebury. In addition to midd.data’s “Introduction to Data” and “Data Science Across Disciplines” courses, we encourage students to check out the following offerings across Middlebury College’s academic departments and programs. These courses do not have pre-requisites and are appropriate for students who are data-curious and don’t have much prior experience.
Courses offered in the past four years. Courses offered currently are as noted.
CSCI 0145
Current
Upcoming
Introduction to Computing
Course Description
Introduction to Computing
In this course we will provide a broad introductory overview of the discipline of computer science, with no prerequisites or assumed prior knowledge of computers or programming. A significant component of the course is an introduction to algorithmic concepts and to programming using Python; programming assignments will explore algorithmic strategies such as selection, iteration, divide-and-conquer, and recursion, as well as introducing the Python programming language. Additional topics will include: the structure and organization of computers, the Internet and World Wide Web, abstraction as a means of managing complexity, social and ethical computing issues, and the question "What is computation?" 3 hr. lect./1 hr. lab
Terms Taught
Requirements
CSCI 0150
Computing for the Sciences
Course Description
Computing for the Sciences
In this course we will provide an introduction to the field of computer science geared towards students interested in mathematics and the natural sciences. We will study problem-solving approaches and computational techniques utilized in a variety of domains including biology, chemistry, physics, and engineering. Students will learn how to program in Python and other languages, how to extract information from large data sets, and how to utilize a variety of tools employed in scientific computation. The course has no prerequisites and assumes no prior experience with programming or computer science. (Juniors and Seniors by waiver) 3 hrs. lect./lab
Terms Taught
Requirements
ECON 0111
Current
Upcoming
Economic Statistics
Course Description
Economic Statistics (formerly ECON 0210)
An introduction to the discipline of statistics as a science of understanding and analyzing
data with an emphasis on applications to economics. Key topics include descriptive statistics, probability distributions, sampling, random variables, the Central Limit Theorem, estimation, hypothesis testing, p-values, and linear regression. Students will be introduced to a statistical programming language. A weekly one-hour lab is part of this course in addition to three hours of class meetings per week. (Formerly ECON 0210) (Not open to students who have taken ECON 0210, MATH 0116, MATH 0310, PSYC 0201, STAT 0116 [formerly MATH 0116] or STAT 0201.) 3 hrs. lect., 1 hr. lab
Terms Taught
Requirements
SOCI 0255
Upcoming
Data and the Social World
Course Description
Data and the Social World
Digital data and computational tools have transformed social science research. In this course we will learn about the tradition and logics of computational social science and learn how to apply it to their own sociological questions. Half of each class will be spent discussing published research: evaluating the methodological approach to the research question, reviewing the ethics or limitations of the data, and assessing the communication of results. The other half will be devoted to hands-on lab sessions, where students will learn the foundations of data science through computational research and the R statistical software language. These labs will cover the basics of reproducible workflows, and data collection, analysis, and visualization. (This course is not open to students who have already completed STAT 0118 or STAT 0201. Not open to seniors.)
Terms Taught
Requirements
STAT 0116
Current
Upcoming
Intro to Statistical Science
Course Description
Introduction to Statistical Science (formerly MATH 0116)
A practical introduction to statistical methods and the examination of data sets. Computer software will play a central role in analyzing a variety of real data sets from the natural and social sciences. Topics include descriptive statistics, elementary distributions for data, hypothesis tests, confidence intervals, correlation, regression, contingency tables, and analysis of variance. The course has no formal mathematics prerequisite, and is especially suited to students in the physical, social, environmental, and life sciences who seek an applied orientation to data analysis. (Not open to students who have taken BIOL 0211 or ECON 0111 (formerly ECON 0210) or PSYC 0201) 3 hrs. lect./1 hr. computer lab.
Terms Taught
Requirements
STAT 0118
Current
Upcoming
Introduction to Data Science
Course Description
Introduction to Data Science (formerly MATH 0118)
In this course students will gain exposure to the entire data science pipeline: forming a statistical question, collecting and cleaning data sets, performing exploratory data analyses, identifying appropriate statistical techniques, and communicating the results, all the while leaning heavily on open source computational tools, in particular the R statistical software language. We will focus on analyzing real, messy, and large data sets, requiring the use of advanced data manipulation/wrangling and data visualization packages. Students will be required to bring a laptop (owned or college-loaned) to class as many lectures will involve in-class computational activities. (formerly MATH 0216) 3 hrs lect./disc. (Not open to students who have taken BIOL 1230, ECON 1230, ENVS 1230, FMMC 1230, GEOG 1230, HARC 1230, JAPN 1230, LNGT 1230, MATH 1230, NSCI 1230, PSCI 1230, SOCI 1230, or WRPR 1230.)
Terms Taught
Requirements
Higher Level Courses
Higher-level courses across Middlebury’s curriculum offer students the opportunity to deepen their knowledge and application of data analysis and computing. Below we highlight some of these next-step courses designed to follow introductory courses. Please consult the course description for information about pre-requisites and any enrollment restrictions, including major restrictions.
Courses offered in the past four years. Courses offered currently are as noted.
BIOL 0211
Current
Upcoming
Biostatistics
Course Description
Experimental Design and Statistical Analysis
Experimental design is one of the most important parts of doing science, but it is difficult to do well. How do you randomize mice? How many replicate petri plates should be inoculated? If I am measuring temperature in a forest, where do I put the thermometer? In this course students will design experiments across the sub-areas of biology. We will run student designed experiments, and then learn ways to analyze the data, and communicate the results. Students planning to do independent research are encouraged to take this course. (BIOL 0140 or BIOL 0145).
Terms Taught
Requirements
CSCI 0201
Current
Upcoming
Data Structures
Course Description
Data Structures
In this course we will study the ideas and structures helpful in designing algorithms and writing programs for solving large, complex problems. The Java programming language and object-oriented paradigm are introduced in the context of important abstract data types (ADTs) such as stacks, queues, trees, and graphs. We will study efficient implementations of these ADTs, and learn classic algorithms to manipulate these structures for tasks such as sorting and searching. Prior programming experience is expected, but prior familiarity with the Java programming language is not assumed. (CSCI 0145 or CSCI 0146 or CSCI 0150) 3 hrs. lect./lab
Terms Taught
Requirements
CSCI 0311
Upcoming
Artificial Intelligence
Course Description
Artificial Intelligence
Artificial Intelligence (AI) is the study of computational systems that exhibit rational behavior. Applications include strategic game playing, medical diagnosis, speech and handwriting recognition, Internet search, and robotics. Course topics include intelligent agent architectures, search, knowledge representation, logical reasoning, planning, reasoning under uncertainty, machine learning, and perception and action. We will also discuss the social implications of AI systems. This course fulfills the Responsible Computing requirement for the Computer Science major. (CSCI 0200 and CSCI 0201) 3 hrs. lect./lab
Terms Taught
Requirements
ECON 0211
Current
Upcoming
Regression Analysis
Course Description
Introduction to Regression Analysis
In this course regression analysis is introduced. The major focus is on quantifying relationships between economic variables. Multiple regression identifies the effect of several exogenous variables on an endogenous variable. After exploring the classical regression model, fundamental assumptions underlying this model will be relaxed, and further new techniques will be introduced. Methods for testing hypotheses about the regression coefficients are developed throughout the course. Both theoretical principles and practical applications will be emphasized. The course goal is for each student to employ regression analysis as a research tool and to justify and defend the techniques used. (MATH 0121; and ECON 0111, (formerly ECON 0210) ECON 0150 or ECON 0155) Please note: STAT 0211 may not be used to fulfill the ECON 0211 Regression requirement for the Economics major. 3 hrs. lect., 1 hr. lab
Terms Taught
Requirements
ECON 0311
Upcoming
Causal Inference
Course Description
Causal Inference
“Correlation is not causation” is a frequent refrain from people investigating relationships in data. But what does this mean? In this course we will focus on empirical tools that economists use to identify causal relationships. Students will explore the concept of causality and estimation of counterfactuals using randomized and natural experiments to study economic and social phenomena. Students will learn to apply the main research designs used by economists including randomized control trials (RCTs), difference-in-differences estimation, event studies, instrumental variables, and regression discontinuity. The ethics of conducting empirical research will also be emphasized throughout the course. (ECON 0211) (Formerly ECON 212) 3 hrs. lect.
Terms Taught
GEOG 0120
Human Geography with GIS
Course Description
Human Geography with GIS
How do geographers study spatial interactions between people and the environment? How does socio-economic status relate to spatial patterns of settlement, social organization, access to resources, and exposure to risks? How can geographic information systems (GIS) help geographers explain these spatial patterns and processes? In this course we will apply GIS to a wide range of topics in human geography including urban, environmental, political, hazards, and health. We will learn how to gather, create, analyze, visualize, and critically interpret geographic data through tutorials, collaborative labs, and independent work that culminate in cartographic layouts of our results. 3 hrs. lect./3 hrs. lab.
Terms Taught
Requirements
GEOG 0150
Mapping Global Envrn Change
Course Description
Mapping Global Environmental Change
How do geographers use geospatial technologies to observe the Earth’s surface? How do geographers use this information to interpret changes in the global environment across space and time? In this course we will learn how to work with large geographic datasets to explore patterns and changes to the Earth’s surface at local to global scales. Case studies will use remotely-sensed images to study land cover, climate, weather, wildfire, and other topics. Students will learn concepts, methods, and ethics for using a cloud-based geospatial analysis platform to process data, critically interpret workflows and results, and communicate findings with web maps and graphics. 4 hrs. lect./1.5 hrs. lab.
Terms Taught
Requirements
GEOG 0231
Cartography
Course Description
Cartography
How do maps work? What are their intended uses and impacts? How do maps differ across cultures and times? In this course we will explore these questions through a series of practical exercises, readings, discussions, and critiques. We will learn fundamental concepts, principles, and patterns for using graphics to depict geographical ideas. We will practice both manual and digital methods for making maps, including GIS and graphics software, and compare frameworks and paradigms for evaluating map style and use. 3 hrs. lect./3 hrs. lab.
Terms Taught
Requirements
GEOG 0351
Current
Upcoming
Remote Sensing & Land Use
Course Description
Applied Remote Sensing: Land Use in Sub-Saharan Africa
Satellite images are indispensable for mapping forest cover, agriculture, and other land uses. Off-the-shelf products struggle to capture features in complex landscapes, such as fine-scale forest changes, urban sprawl, or small agricultural fields. In this course we will focus on sub-Saharan Africa to investigate select land uses with remote sensing techniques, discuss their social contexts, and practice novel approaches for generating land use maps. Students will be actively engaged in carrying out analyses and critical interpretations throughout the semester. Their work will culminate in a web-based portfolio, which will provide an opportunity to learn effective communication of research findings. (GEOG 0251 or GEOG 0252 or by instructor approval) and GEOG 0261 is recommended 3 hrs. lect./3hrs lab.
Terms Taught
Requirements
GEOG 0361
Open GIScience
Course Description
Open Geographic Information Science (formerly GEOG 0323)
In this course we will study geographic information science (GIS) with open-source software and critical GIS scholarship. In labs, we will practice techniques to include: data acquisition and preparation for analysis, spatial SQL database queries, automating analysis, spatial interpolation, testing sensitivity to error and uncertainty, and data visualization. We will read and apply critical research of GIS as a subject and with GIS as a methodology. Spatial data sources for labs and independent research projects may include remote sensing, micro-data, smart cities and open government data, and volunteered geographic information (e.g. OpenStreetMap and social media). (GEOG 0120 or GEOG 0150 or GEOG 1230) 3 hrs. lect./disc./3 hrs. lab
Terms Taught
Requirements
PSCI 0210
Upcoming
Frontiers in Political Science
Course Description
Frontiers in Political Science Research
Nothing is more controversial among political scientists than the topic of how to study politics. In this course, we consider a variety of advanced techniques for studying political phenomena, including statistical methods, game theory, institutional analysis, case study techniques, experiments, and agent-based modeling. We will work with concrete examples (drawn from major political science journals) of how scholars have used these techniques, and consider the ongoing philosophical controversies associated with each approach. Students will have the opportunity to conduct original research using a method and subject of their choosing. (Any political science courses) 3 hrs. lect.disc (Methods)
Terms Taught
Requirements
PSYC 0201
Current
Upcoming
Psychological Statistics
Course Description
Psychological Statistics
This course will examine statistical methods used in the behavioral and biological sciences. Students will learn the logic underlying statistical analysis, focusing primarily on inferential techniques. They also will become familiar with the application and interpretation of statistics in psychological empirical research, including the use of computer software for conducting and interpreting statistical analyses. (PSYC 0105; open to psychology and neuroscience majors, others by waiver. Not open to students who have taken MATH 0116 (aka STAT 0116) or STAT 0201 or ECON 0210) 3 hrs. lect./1.5 hr. lab
Terms Taught
Requirements
SOCI 0226
Current
Upcoming
Social Networks
Course Description
Social Networks
Networks have always been the backbone of social life, long before social media, or email, people spread information through letters, commercial exchange, or simply face to face interactions. These ties embed us into an invisible web of connections that, through the methods of network analysis, we can make tangible and analyze. In this course students will engage with consequences of connectivity and understand why small changes in the structure of our ties can lead to big differences in how networks behave. In weekly hands-on sessions, students will learn the basics of network analysis using open-source software like R and Gephi and will collect, describe, and visualize a social network of their choosing for the final project. (SOCI 0255 Or STAT 0116 Or STAT 0118 Or STAT 0201, or instructor approval.)
Terms Taught
Requirements
SOCI 0385
Social Statistics
Course Description
Social Statistics
In this course we will learn the practical tools social sociologists and other scientists use to analyze data quantitatively. Topics will emphasize applications with statistical software and data from the General Social Survey and other datasets. We will explore methods to describe statistics about samples, apply the principles of probability to make predictions about populations, and estimate the significance of those predictions through inference and hypothesis testing. We will conclude with an introduction to linear regression. (SOCI 0101 or SOCI 0105) 3 hrs. lect./disc.
Terms Taught
Requirements
STAT 0201
Current
Upcoming
Intro to Stat and Data Sci
Course Description
Introduction to Statistical and Data Sciences
An introduction to statistical methods and the examination of data sets for students with a background in calculus. Topics include descriptive statistics, elementary distributions for data, hypothesis tests, confidence intervals, and regression. Students develop skills in data cleaning, wrangling, visualization, and model fitting using the Statistical Software R. Emphasis will be placed on reproducibility. (MATH 0121 or equivalent, or by placement.)
(Not open to students who have taken MATH 0116, MATH 0118, ECON 0111 (formerly ECON 0210), PSYC 0201, STAT 0116, STAT 0118, BIOL 1230, ECON 1230, ENVS 1230, FMMC 1230, HARC 1230, JAPN 1230, LNGT 1230, NSCI 1230, MATH 1230, SOCI 1230, LNGT 1230, PSCI 1230, WRPR 1230, or GEOG 1230.)
Terms Taught
Requirements
STAT 0211
Current
Upcoming
Regression
Course Description
Regression Theory and Applications (formerly MATH 0211)
Regression is a popular statistical technique for making predictions and for modeling relationships between variables. In this course we will discuss the theory and practical applications of linear, log-linear, and logistic regression models. Topics include least squares estimation, coding for categorical predictors, analysis of variance, and model diagnostics. We will apply these concepts to real datasets using R, a statistical programming language. (Concurrent or prior MATH 0200, and STAT 0116 or STAT 0201 or PSYC 0201 or ECON 0111) (Not open to students who have taken ECON 0211.) 3 hrs lect./disc.
Terms Taught
Requirements
STAT 0218
Upcoming
Statistical Learning
Course Description
Statistical Learning (formerly MATH 0218)
This course is an introduction to modern statistical, machine learning, and computational methods to analyze large and complex data sets that arise in a variety of fields, from biology to economics to astrophysics. The theoretical underpinnings of the most important modeling and predictive methods will be covered, including regression, classification, clustering, resampling, and tree-based methods. Student work will involve implementation of these concepts using open-source computational tools. (STAT 0118 or STAT 0201 or BIOL 1230 or ECON 1230 or ENVS 1230, or FMMC 1230 or GEOG 1230 or HARC 1230 or JAPN 1230 or LNGT 1230 or MATH 1230 or NSCI 1230 or PSCI 1230 or SOCI 1230 or WRPR 1230) 3 hrs. lect./disc.
Terms Taught
Requirements
STAT 0310
Current
Upcoming
Probability
Course Description
Probability
An introduction to the concepts of probability and their applications, covering both discrete and continuous random variables. Probability spaces, elementary combinatorial analysis, densities and distributions, conditional probabilities, independence, expectation, variance, weak law of large numbers, central limit theorem, and numerous applications. (concurrent or prior MATH 0223 or MATH 0224) 3 hrs. lect./disc.
Terms Taught
Requirements
STAT 0311
Current
Upcoming
Statistical Inference
Course Description
Statistical Inference
An introduction to the mathematical methods and applications of statistical inference using both classical methods and modern resampling techniques. Topics will include: permutation tests, parametric and nonparametric problems, estimation, efficiency and the Neyman-Pearsons lemma. Classical tests within the normal theory such as F-test, t-test, and chi-square test will also be considered. Methods of linear least squares are used for the study of analysis of variance and regression. There will be some emphasis on applications to other disciplines. This course is taught using R. (Concurrent or prior MATH 0200, and MATH/STAT 0310) 3 hrs. lect./disc.
Terms Taught
Requirements
MiddLab Workshops
If you would like to organize a workshop for your class, lab, student organization, or department, MiddLab can help. Members of MiddLab run workshops for summer research assistants, the economics department faculty, the Women in Computer Science student organization, and more.
Topics and technologies they can teach workshops on include:
- Introduction to R and RStudio
- Data wrangling with R and the tidyverse
- Data visualization in R
- Introductory GIS work with R, QGIS, ArcGIS Online, etc.
- Introduction to working with data
- The UNIX shell
- git and GitHub for version control
- Introduction to text mining and analysis
- Data cleaning with OpenRefine
- Public and open data sources
- Data management planning
- Creating digital exhibits using Omeka
If you don’t see a topic or tool you would like a workshop to cover, please reach out to us at middlab@middlebury.edu and we can discuss further.