Tracking Our Sustainability Commitments: Greenhouse Gas and Waste Auditing
Data-Driven Sustainability
Sustainability is a core strategic priority at the Middlebury Institute. In 2019, the Institute adopted the MIIS Climate Action Plan (CAP), which guides GHG emission and waste reduction initiatives and promotes sustainability efforts across campus. To track our progress towards the goals outlined in the CAP, the MIIS Sustainability Graduate Assistants conduct consistent waste, water, and GHG emissions audits. This data serves as a key component of campus sustainability tracking, allowing us to highlight progress, inform future initatives, and fulfill our commitment to transparency for MIIS students, faculty, and the general public.
Greenhouse Gas Inventory
2023/2024 GHG Inventory Full Report
The Middlebury Institute of International Studies Greenhouse Gas Inventory is a comprehensive accounting of greenhouse gas emissions across all Institute facilities, assets, and activities. A critical tool for measuring emission reduction progress and informing GHG reduction strategies, the Inventory ensures transparency and accountability in sustainability at MIIS while reinforcing the Institute’s dedication to climate leadership in higher education.
Since 2008, students have collaborated with faculty experts to establish an energy usage and emissions baseline for the campus. Using Greenhouse Gas Protocol guidelines published by the World Resources Institute and the United States Environmental Protection Agency (US EPA), these inventories provide the school with emissions data that are used to track progress in reducing Scope 1, 2, and 3 emissions over time. To learn more about the difference between Scope 1, Scope 2, and Scope 3 emissions, click here.
Below you can find the summary of results from the Institute’s FY2023-2024 GHG Inventory. These statistics serve as a tracking device for you and help guide future emissions reduction initatives on campus. Moving forward, we will continue to work toward our goals to further reduce greenhouse gas emissions and achieve net-zero emissions by 2028.
Year-by-Year CO2 Emissions Comparison (in Metric Tonnes)
Middlebury Institute of International Studies
| Fiscal Year | Scope 1A- Stationary Combustion | Scope 1B- Mobile Combustion | Scope 2- Purchased Electricity | Scope 3A- Travel | Scope 3B- Waste | Grand Total |
|---|---|---|---|---|---|---|
| 2008-2009 | 240.8 | 6.7 | 294.08 | 2185 | 11.32 | 2737.9 |
| 2011-2012 | 213.9 | 8.4 | 234.2 | 1643 | 11.15 | 2110.65 |
| 2014-2015 | 141.8 | 1.1 | 191.5 | 706 | 17.78 | 1058.18 |
| 2017-2018 | 190.9 | 2.3 | 136.14 | 968.1 | 13.93 | 1311.37 |
| 2020-2021 | 141.8 | 1.1 | 157.2 | 44.3 | 3.09 | 347.49 |
| 2023-2024 | 165.4 | 1 | 0 | 774 | 14.77 | 955.17 |

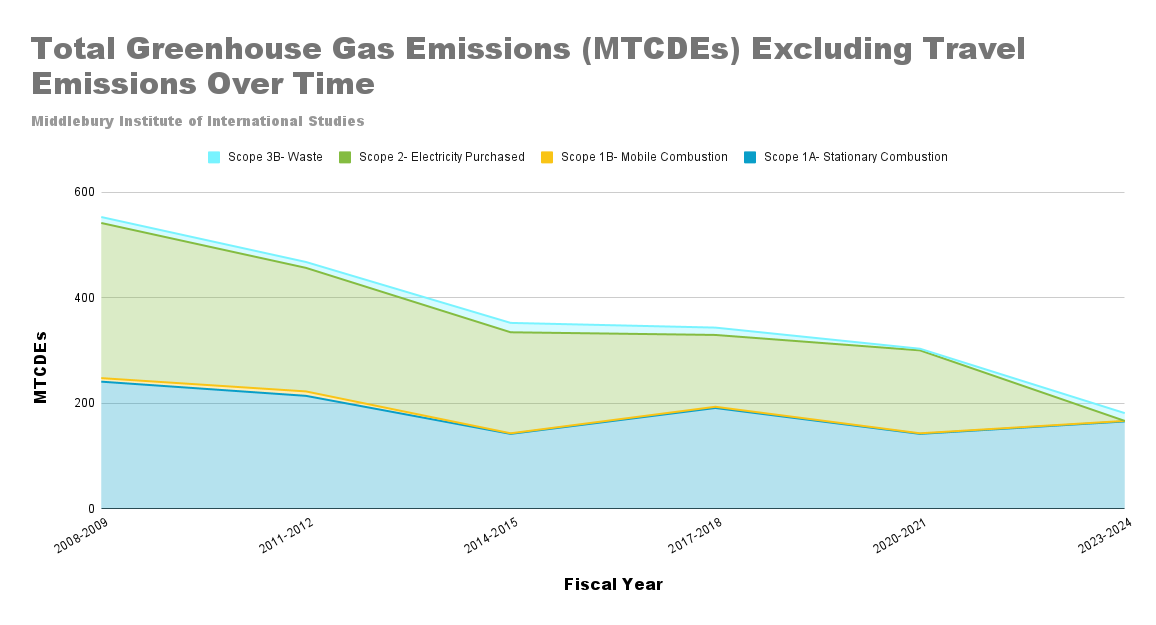
Across all scopes, GHG emissions at MIIS have declined substantially since FY 2008. Total emissions decreased from an annual 2,737.9 MTCDEs in FY 2008 to 955.17 MTCDEs in FY 2023, representing a 65% reduction in campus-wide emissions over the target time period. This downward trend reflects significant progress toward the Institute’s goal of achieving net-zero emissions by 2028. However, despite this progress, emissions reductions have been uneven across scopes, with some major successes and other key opportunities for future improvements. For more information please view the complete FY 23/24 GHG Inventory Report above.
Emissions resulting from the Institute’s travel and heating remain the largest components of the campus footprint. This is a major challenge that the Sustainability Council and facilities team are working to address. More details about our efforts mitigate our greenhouse gas emissions can be found in the “Energy2028: Climate Action Plan” tab.
Campus Waste Audits
The Institute is committed to minimizing waste and increasing recycling whenever possible. The Sustainability Council continuously monitors, documents, and tracks the progress of weekly campus waste output. Our 2015–2016 waste metrics were as follows:
- Average Weekly Waste: 1,297 lbs.
- Average Waste Recycled Weekly: 599 lbs.
- Average % Waste Recycled Weekly: 46%
Goals
On July 1, 2010, the Institute officially merged with Middlebury to become a Graduate School of Middlebury College. Accompanying the merger, the Institute set a goal of recycling at least 40 percent of its waste. At 46 percent ofwaste recycled weekly, we reached our recycling rate goal! However, we are not stopping here. We will continue to work with students, staff, and faculty to ensure that this upward trend continues into the coming years. In addition, we are also working on increasing our composting capacity. Stay tuned for more news soon!
Battery recycling
Since February 2008, the Institute has been collecting used batteries in special recycling bins throughout campus. To date, the Institute has recycled more than 2,475 pounds of batteries!
Other Components of the Carbon Neutrality Initiative include:
Energy and Lighting Overhaul Program
We make every effort to reduce our energy consumption and minimize our greenhouse gas emissions. The Institute has partnered with the Association of Monterey Bay Area Governments (AMBAG) Energy Watch to complete a campuswide analysis of and retrofit our electrical and lighting systems. The retrofits included new higher-efficiency ballasts, CFL lights, motion sensors, and timers. This program is expected to save hundreds of thousands of dollars and take thousands of tons of carbon dioxide out of the air over the next 20 years. These funds can be used to offset our remaining emissions.
In July 2016, as part of our continual effort to improve our energy efficiency and reduce overall energy consumption, we replaced 90 percent of all interior lights with LED bulbs. LED (light-emitting diode) is one of today’s most energy-efficient and rapidly developing technologies. By switching to LED bulbs, we kept 84.5 metric tons of carbon dioxide in just six months from being emitted into the atmosphere—this is equivalent to the greenhouse gas emissions from over 200,000 miles driven by an average passenger vehicle or almost four garbage trucks of waste recycled instead of landfilled.
Trash and Recycling
The Institute has purchased new, standardized trash and recycling bins for the campus. Bins are located throughout campus and in every classroom, with signage explaining what can be recycled. A “Techno Trash” receptacle is also available in Media Services. You can use it to recycle CDs, DVDs, and cables, as well as other small electronics. According to California state law, these materials cannot be disposed of as general trash due to the hazardous materials (i.e., mercury, arsenic, and other heavy metals) that they contain. We recycle hundreds of electronic products every semester.
Battery and CFL Recycling
Brown containers, in which you can deposit expired batteries, are in several select locations across campus. Since 2008, we have collected over 2,000 pounds of batteries for recycling. Blue buckets for recycling Compact Fluorescent Lamps (CFLs) are located in five areas across campus: the first floor of the William Tell Coleman Library, the Samson Reading Room, the GSIPM front desk, the McGowan lobby, and in Office Services.
Composting
There are a number of compost bins around campus. We are in the process of increasing the availability of compost in a number of buildings, but for now, the two compost bins are currently located in the Holland Center and the Samson Center Cafe. Composting services are provided throughout Monterey by the Monterey Disposal Service.
Freecycling
The Institute minimizes landfill disposal of outdated but still usable items. Annual “freecycle” events are scheduled near the beginning of the academic year to offer such items for free to the MIIS community. Any unclaimed items are then offered to the Monterey community, and finally they are donated to the Last Chance Mercantile at the Monterey Regional Waste Management District.
Water
California has been feeling the effects of severe and worsening water shortages for decades. Monterey County is a critically drought-sensitive area, and the Institute is committed to consuming water responsibly. We have already launched several programs to reduce our consumption and limit pollution levels in our runoff, and free home water efficiency devices—including shower timers, shower heads, leak detectors, and garden hose spray nozzles—are available at the reception desk in the Segal Building. The following retrofits have been installed across campus:
- Low-flow and sensor flush toilets
- Sensor-response faucets
- A filtration system under the Samson Center that cleans the water before it is released into the bay
- A rainwater catchment system on the Morse Building that enables the capture and use of rainwater in the Our Green Thumb garden
- Water fountains that accommodate water bottles and dispense cold, filtered drinking water in the following campus locations: the Samson Student Center Dining Room, the McCone lobby, the McCone Lower Atrium, the Holland Center, and on each floor of McGowan.
MIIS has set ambitious water reduction goals. Progress is tracked via the water audit, which can be viewed below.
